empty
08.02.2023 08:17 PM
Technical analysis of EUR/USD for February 08, 2023

This image is no longer relevant

Overview:

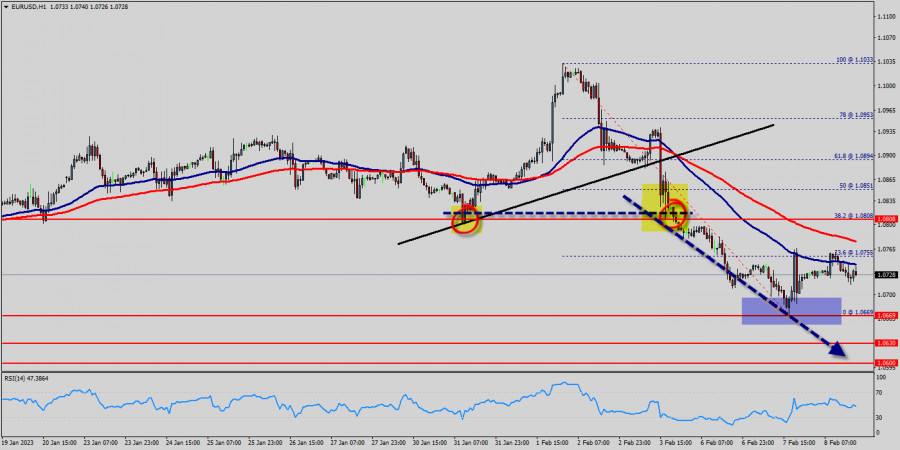
The EUR/USD pair has faced strong resistances at the levels of 1.0880 because support had become resistance last week. So, the strong resistance has been already formed at the level of 1.0880 and the pair is likely to try to approach it in order to test it again. However, if the pair fails to pass through the level of 1.0880, the market will indicate a bearish opportunity below the new strong resistance level of 1.0880 (the level of 1.0880 coincides with a ratio of 38.2% Fibonacci - last bullish wave - double top).

Moreover, the RSI starts signaling a downward trend, as the trend is still showing strength above the moving average (100) and (50). The trend of EUR/USD pair movement was controversial as it took place in the downtrend channel.

Due to the previous events, the price is still set between the levels of 1.0808 and 1.0669, so it is recommended to be careful while making deals in these levels because the prices of 1.0808 and 1.0669 are representing the resistance and support respectively.

Therefore, it is necessary to wait till the downtrend channel is passed through. Then the market will probably show the signs of a bearish market.

It should be noted that the volatility is very high for that the price of the EUR/USD pair is still trading between the prices of 1.0669 and 1.0808 in the coming hours.

Furthermore, the price has been set below the strong resistance at the levels of 1.0808 and 1.0851 which coincide with the 38.2% and 50% Fibonacci retracement levels respectively.

Thus, the market is indicating a bearish opportunity below 1.0808 so it will be good to sell at 1.0808 with the first target of 1.0669.

It will also call for a downtrend in order to continue towards 1.0630. The daily strong support is seen at 1.0600.

However, the stop loss should always be taken into account, for that it will be reasonable to set your stop loss at the level of 1.0851.

Moving averages, in the meantime, maintain their bearish slope way above the current level. Furthermore, although the news is bearish for the EUR/USD pair, professional may not want to sell weakness, but rather following a rebound rally.

Additionally, some aggressive counter-trend buyers may be defending parity. In case a continuousion takes place and the EUR/USD pair breaks through the support level of 1.0669 , a further decline to 1.0600 can occur which would indicate a bearish market.

Signal :

It should be noted that the 1.0808 price will act as a major resistance on Feb. 08th, 2023. Therefore, it will be too gainful to sell short below 1.0808 and look for further downside with 1.0669, 1.0630 and 1.0600 targets. It should also be reminded that stop loss must never exceed the maximum exposure amounts. Thus, stop loss should be placed at the 1.0851 level today.

Mourad El Keddani,
الخبير التحليلي لدى شركة إنستافوركس
© 2007-2025
Summary
Urgency
Analytic
Mourad El Keddani
Start trade
كسب عائد من تغيرات أسعار العملات المشفرة مع إنستافوركس.
قم بتحميل منصة التداول ميتاتريدر 4 وافتح أول صفقة.
  • Grand Choice
    Contest by
    InstaForex
    InstaForex always strives to help you
    fulfill your biggest dreams.
    انضم إلى المسابقة

المقالات الموصى بها

التوقعات لليورو/الدولار الأمريكي في 24 يوليو 2025

يوم الأربعاء، ارتد زوج اليورو/الدولار الأمريكي من مستوى تصحيح فيبوناتشي 127.2% عند 1.1712، وانعكس لصالح اليورو، واستمر في الارتفاع نحو مستوى 1.1802. الارتداد من 1.1802 سيفضل الدولار الأمريكي ويؤدي

Samir Klishi 11:21 2025-07-24 UTC+2

التوقعات لزوج الجنيه الإسترليني/الدولار الأمريكي في 24 يوليو 2025

على الرسم البياني الساعي، استقر زوج الجنيه الإسترليني/الدولار الأمريكي فوق مستوى تصحيح فيبوناتشي 61.8% عند 1.3530 يوم الأربعاء وارتفع إلى مستوى 50.0% عند 1.3579. اليوم، الارتداد من هذا المستوى سيفضل

Samir Klishi 11:05 2025-07-24 UTC+2

إشارات التداول لعملة البيتكوين للفترة من 24 إلى 27 يوليو 2025: الشراء فوق 117,000 دولار (6/8 Murray - 21 SMA)

يتداول البيتكوين فوق المقاومة القوية عند خط 6/8 Murray، مما قد يشير إلى استمرار الحركة الصعودية في الأيام القادمة، وربما يصل إلى خط 7/8 Murray حول 121,875 دولار. إذا استقر

Dimitrios Zappas 06:25 2025-07-24 UTC+2

إشارات التداول للذهب (XAU/USD) للفترة من 24 إلى 27 يوليو 2025: البيع تحت مستوى 3,400 دولار (21 SMA - 7/8 Murray)

كما ذكرنا في تحليلنا يوم أمس، أخذ الذهب استراحة من ارتفاعه القوي بعد وصوله إلى مستويات مقاومة قوية وحالة تشبع شرائي. بعد تصحيح تقني دون مستوى 3,437، انخفض الذهب بسرعة

Dimitrios Zappas 06:23 2025-07-24 UTC+2

إشارات التداول لليورو/الدولار الأمريكي للفترة من 24 إلى 27 يوليو 2025: الشراء فوق 1.1745 (21 SMA - 8/8 Murray)

من الناحية الفنية، يصل اليورو إلى مستويات الإرهاق. في التداولات الأخيرة، يمكن رؤية الشموع اليابانية المسماة "دوجي" على الرسم البياني الفني، مما يشير إلى تردد السوق. من المحتمل حدوث تصحيح

Dimitrios Zappas 06:18 2025-07-24 UTC+2

إذا تمكن مستوى الدعم 6327.24 في مؤشر S&P 500 من الصمود أمام التصحيح الهبوطي اليوم، فسوف يؤدي ذلك إلى تجدد القوة. الخميس، 24 يوليو 2025.

مؤشر S&P 500 – الخميس، 24 يوليو 2025. مع تقاطع المتوسط المتحرك الأسي الذهبي EMA(50) فوق EMA(200)، يسيطر المشترون بشكل كبير. على الرغم من أن مؤشر القوة النسبية RSI(14)

Arief Makmur 05:54 2025-07-24 UTC+2

على الرغم من أن المشترين لا يزالون يهيمنون على مؤشر Nasdaq 100، إلا أن هناك احتمالاً لتصحيح هبوطي اليوم، الخميس، 24 يوليو 2025.

مؤشر ناسداك 100 – الخميس، 24 يوليو 2025. ظهور تباين بين حركة سعر مؤشر ناسداك 100 ومؤشر RSI(14) يشير إلى أن #NDX لديه إمكانية لتصحيح محدود في المستقبل القريب،

Arief Makmur 05:53 2025-07-24 UTC+2

توقعات EUR/USD ليوم 24 يوليو 2025

وسط التفاؤل المستمر في أسواق الأسهم الذي يحركه الاتفاق التجاري بين الولايات المتحدة واليابان، انخفض مؤشر الدولار بنسبة 0.18% أمس، بينما ارتفع اليورو بنسبة 0.16% (16 نقطة). لقد استقر السعر

Laurie Bailey 05:18 2025-07-24 UTC+2

توقعات GBP/USD ليوم 24 يوليو 2025

وسط التفاؤل العام في السوق (S&P 500 +0.78%)، ارتفع الجنيه الإسترليني بمقدار 48 نقطة أمس. كان هذا كافيًا لجعل مذبذب مارلين على المقياس اليومي ينتقل إلى المنطقة الإيجابية

Laurie Bailey 05:18 2025-07-24 UTC+2

توقعات AUD/USD ليوم 24 يوليو 2025

تمكن الدولار الأسترالي من اختراق مستويات مقاومة قوية ممثلة في خط MACD وخط قناة السعر. وقد استقر مؤشر Marlin في المنطقة الإيجابية، مما يفتح الطريق أمام احتمال ارتفاع نحو مستوى

Laurie Bailey 05:18 2025-07-24 UTC+2
لا تستطيع التحدث الآن؟
اطرح سؤالك في الدردشة.
Widget callback
 

Dear visitor,

Your IP address shows that you are currently located in the USA. If you are a resident of the United States, you are prohibited from using the services of InstaFintech Group including online trading, online transfers, deposit/withdrawal of funds, etc.

If you think you are seeing this message by mistake and your location is not the US, kindly proceed to the website. Otherwise, you must leave the website in order to comply with government restrictions.

Why does your IP address show your location as the USA?

  • - you are using a VPN provided by a hosting company based in the United States;
  • - your IP does not have proper WHOIS records;
  • - an error occurred in the WHOIS geolocation database.

Please confirm whether you are a US resident or not by clicking the relevant button below. If you choose the wrong option, being a US resident, you will not be able to open an account with InstaForex anyway.

We are sorry for any inconvenience caused by this message.