empty
18.01.2024 05:19 AM
Trading Signals for GOLD on January 18-19, 2024: buy above $2,000 (rebound- 4/8 Murray)

This image is no longer relevant

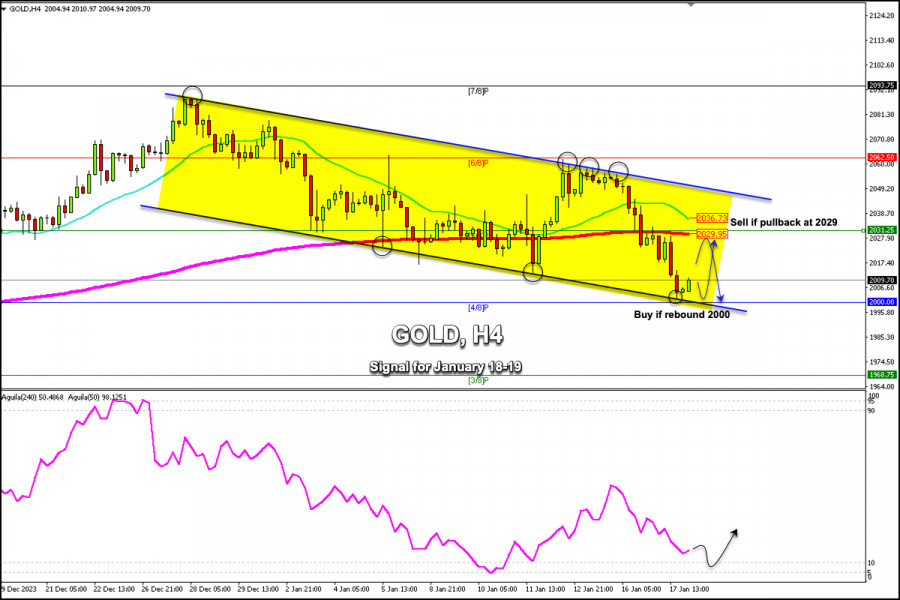
Early in the European session, gold is trading around 2,009.70, below the 21 SMA, and below the 200 EMA. We can see on the H4 chart that gold has been trading within a bearish trend channel forming since December 26. Yesterday, it reached the bottom of this channel around the $2,001.76 level.

The fall of gold accelerated after it broke the 200 EMA located at 2,030, failing to consolidate above this level. We saw a strong downward acceleration with the price reaching the low of 2,001.

One factor weakening the strength in gold was the good retail sales data from the US which pushed up Treasury bond yields and in turn, this weakened the strength of the XAU.

We invite you to review our previous analyses regarding gold. Yesterday, we indicated strong selling pressure supported by technical indicators and we saw that we obtained good results.

If gold consolidates above the psychological level of $2,000 in the next few hours, we could expect a technical rebound and the price could reach the EMA at 2,029. If this scenario occurs, it could be seen as an opportunity to buy with targets at 2,010, 2,018, and 2,029. A stop loss should be placed in case gold falls below the psychological level.

If gold drops below the psychological level of $2,000, we could expect a strong bearish acceleration and the instrument could reach 3/8 Murray at 1,968, but due to the oversold levels, there will likely be a technical rebound above the psychological level of $2,000 for the next few days.

Dimitrios Zappas,
الخبير التحليلي لدى شركة إنستافوركس
© 2007-2025
حدد الإطار الزمني
5
د
15
د
30
د
1
س
4
ساعات
1
يوم
1
أسبوع
كسب عائد من تغيرات أسعار العملات المشفرة مع إنستافوركس.
قم بتحميل منصة التداول ميتاتريدر 4 وافتح أول صفقة.
  • Grand Choice
    Contest by
    InstaForex
    InstaForex always strives to help you
    fulfill your biggest dreams.
    انضم إلى المسابقة

المقالات الموصى بها

إشارات التداول لليورو/الدولار الأمريكي للفترة من 26 إلى 28 مارس 2025: بيع تحت 1.0808 (21 SMA - 8/8 Murray)

وفقًا للرسم البياني H4، يبدو أن اليورو قد تم بيعه بشكل مفرط، ونعتقد أنه إذا وجد زوج EUR/USD دعمًا قويًا حول مستوى 8/8 Murray عند 1.0742 أو 1.0690، فسيُعتبر

Dimitrios Zappas 15:13 2025-03-26 UTC+2

إشارات التداول للذهب (XAU/USD) للفترة من 26 إلى 28 مارس 2025: البيع تحت مستوى $3,034 (21 SMA - 7/8 Murray)

قد يستمر الذهب في دورته الهبوطية في الأيام القادمة. لتأكيد الاتجاه الهابط، يجب أن نتوقع استقرار السعر تحت 3,020، ثم يمكن أن يصل السعر إلى مستوى 6/8 Murray عند 2,968،

Dimitrios Zappas 15:11 2025-03-26 UTC+2

توقعات الفوركس 26/03/2025: اليورو/الدولار الأمريكي، الجنيه الإسترليني/الدولار الأمريكي، الذهب والبيتكوين

روابط مفيدة: مقالاتي الأخرى متوفرة في هذا القسم دورة InstaForex للمبتدئين التحليلات الشائعة افتح حساب تداول مهم: يجب على المبتدئين في تداول الفوركس أن يكونوا حذرين للغاية عند اتخاذ قرارات

Sebastian Seliga 10:35 2025-03-26 UTC+2

اليورو/الدولار الأمريكي. 26 مارس. الدببة تستعد لهجوم جديد

يوم الثلاثاء، ارتد زوج اليورو/الدولار الأمريكي مرة أخرى من منطقة الدعم 1.0781–1.0797، لكن الثيران أظهروا ضعفًا بسبب عدم وجود خلفية إخبارية داعمة. اليوم، عاد الزوج إلى نفس منطقة 1.0781–1.0797

Samir Klishi 10:32 2025-03-26 UTC+2

الجنيه الإسترليني/الدولار الأمريكي. 26 مارس. التضخم قد يحرك الجنيه

على الرسم البياني لكل ساعة، استمر زوج الجنيه الإسترليني/الدولار الأمريكي في التداول بشكل جانبي يوم الثلاثاء، دون إظهار أي رد فعل على مستوى 1.2931. لذلك، لن يُعتبر الإغلاق الجديد

Samir Klishi 10:29 2025-03-26 UTC+2

التحليل الفني لحركة السعر اللحظية لأزواج العملات المتقاطعة AUD/JPY، الأربعاء 26 مارس 2025.

يمكن ملاحظة على الرسم البياني لمدة 4 ساعات أن زوج العملات المتقاطع AUD/JPY يتحرك في قناة صاعدة بشكل متناغم وهو فوق المتوسط المتحرك الأسي (21) الذي يميل أيضًا إلى الأعلى،

Arief Makmur 09:34 2025-03-26 UTC+2

التحليل الفني لحركة السعر اللحظية لمؤشر ناسداك 100، الأربعاء 26 مارس 2025.

20405.7 مع ظهور التقارب بين حركة سعر مؤشر Nasdaq 100 ومؤشر Stochastic Oscillator وحركة سعر المؤشر فوق المتوسط المتحرك الأسي (21) الذي يميل أيضًا إلى الارتفاع، فإن #NDX لديه

Arief Makmur 09:34 2025-03-26 UTC+2

تحليل فني لزوجي اليورو/الدولار الأمريكي والجنيه الإسترليني/الدولار الأمريكي في 26 مارس

مع بداية الأسبوع، يحاول اللاعبون المتشائمون تأكيد وتوسيع الاتجاه الهبوطي السائد، لكنهم لم يحققوا نتائج قوية بعد — حيث يستمر الزوج في البقاء قريبًا من المستويات الأسبوعية. (1.0819 – 1.0828)

Evangelos Poulakis 04:26 2025-03-26 UTC+2

اليورو/الدولار الأمريكي. 25 مارس. أسبوع ممل في الأفق

يوم الاثنين، ارتفع زوج اليورو/الدولار الأمريكي من مستوى تصحيح فيبوناتشي 200.0% عند 1.0857، وانعكس لصالح الدولار الأمريكي، وانخفض نحو منطقة الدعم بين 1.0781–1.0797. الارتداد من هذه المنطقة اليوم سيفضل اليورو

Samir Klishi 18:04 2025-03-25 UTC+2

GBP/USD. 25 مارس. الجنيه يتحرك في نطاق جانبي

في الرسم البياني لكل ساعة، استقر زوج الجنيه الإسترليني/الدولار الأمريكي فوق مستوى 1.2931 يوم الاثنين، لكن الثيران فشلوا في الحفاظ على الحركة الصعودية وتراجعوا. ثم عاد الزوج للتحرك مرة أخرى

Samir Klishi 17:58 2025-03-25 UTC+2
لا تستطيع التحدث الآن؟
اطرح سؤالك في الدردشة.
Widget callback
 

Dear visitor,

Your IP address shows that you are currently located in the USA. If you are a resident of the United States, you are prohibited from using the services of InstaFintech Group including online trading, online transfers, deposit/withdrawal of funds, etc.

If you think you are seeing this message by mistake and your location is not the US, kindly proceed to the website. Otherwise, you must leave the website in order to comply with government restrictions.

Why does your IP address show your location as the USA?

  • - you are using a VPN provided by a hosting company based in the United States;
  • - your IP does not have proper WHOIS records;
  • - an error occurred in the WHOIS geolocation database.

Please confirm whether you are a US resident or not by clicking the relevant button below. If you choose the wrong option, being a US resident, you will not be able to open an account with InstaForex anyway.

We are sorry for any inconvenience caused by this message.