signal strength 1 of 5

The technical pattern called Head and Shoulders has appeared on the chart of GOLD M5. There are weighty reasons to suggest that the price will surpass the Neckline 3473.12/3476.36 after the right shoulder has been formed. So, the trend is set to change with the price heading for 3476.21.
The M5 and M15 time frames may have more false entry points.
انظر أيضا
- All
- Double Top
- Flag
- Head and Shoulders
- Pennant
- Rectangle
- Triangle
- Triple top
- All
- #AAPL
- #AMZN
- #Bitcoin
- #EBAY
- #FB
- #GOOG
- #INTC
- #KO
- #MA
- #MCD
- #MSFT
- #NTDOY
- #PEP
- #TSLA
- #TWTR
- AUDCAD
- AUDCHF
- AUDJPY
- AUDUSD
- EURCAD
- EURCHF
- EURGBP
- EURJPY
- EURNZD
- EURRUB
- EURUSD
- GBPAUD
- GBPCHF
- GBPJPY
- GBPUSD
- GOLD
- NZDCAD
- NZDCHF
- NZDJPY
- NZDUSD
- SILVER
- USDCAD
- USDCHF
- USDJPY
- USDRUB
- All
- M5
- M15
- M30
- H1
- D1
- All
- Buy
- Sale
- All
- 1
- 2
- 3
- 4
- 5
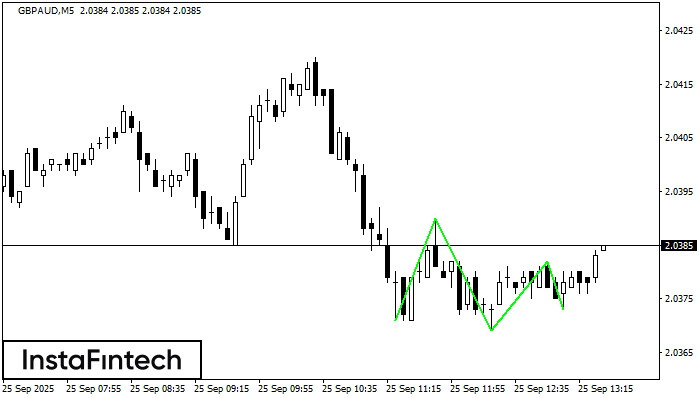
The Triple Bottom pattern has formed on the chart of GBPAUD M5. Features of the pattern: The lower line of the pattern has coordinates 2.0390 with the upper limit 2.0390/2.0382
The M5 and M15 time frames may have more false entry points.
Open chart in a new window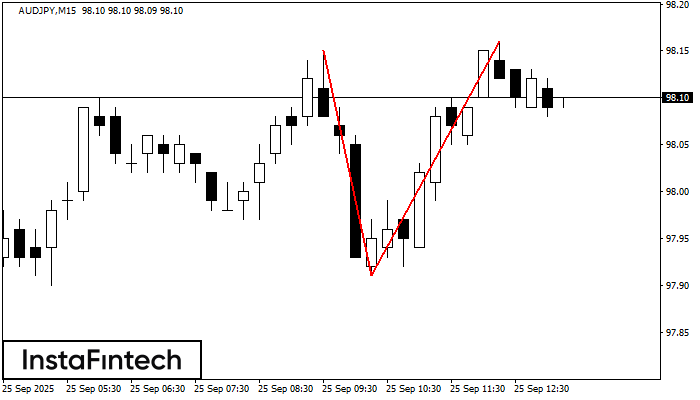
The Double Top reversal pattern has been formed on AUDJPY M15. Characteristics: the upper boundary 98.15; the lower boundary 97.91; the width of the pattern is 25 points. Sell trades
The M5 and M15 time frames may have more false entry points.
Open chart in a new window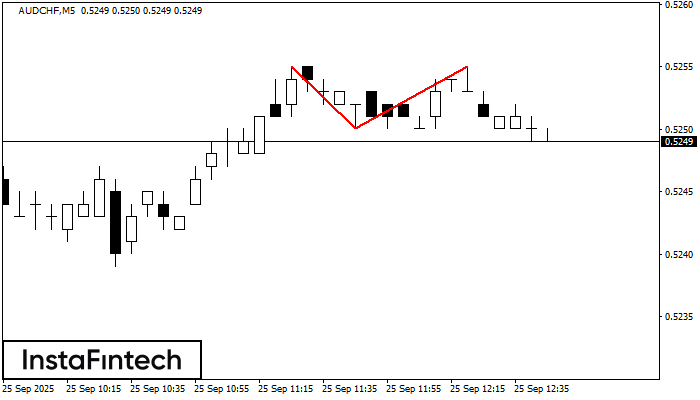
The Double Top reversal pattern has been formed on AUDCHF M5. Characteristics: the upper boundary 0.5255; the lower boundary 0.5250; the width of the pattern is 5 points. Sell trades
The M5 and M15 time frames may have more false entry points.
Open chart in a new window