signal strength 1 of 5
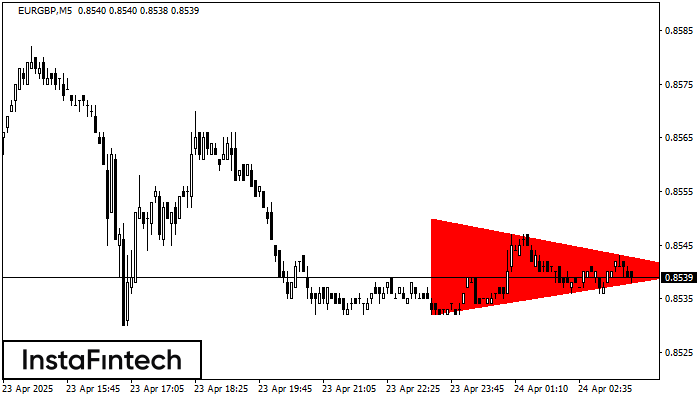
According to the chart of M5, EURGBP formed the Bearish Symmetrical Triangle pattern. This pattern signals a further downward trend in case the lower border 0.8532 is breached. Here, a hypothetical profit will equal the width of the available pattern that is -18 pips.
The M5 and M15 time frames may have more false entry points.
انظر أيضا
- All
- Double Top
- Flag
- Head and Shoulders
- Pennant
- Rectangle
- Triangle
- Triple top
- All
- #AAPL
- #AMZN
- #Bitcoin
- #EBAY
- #FB
- #GOOG
- #INTC
- #KO
- #MA
- #MCD
- #MSFT
- #NTDOY
- #PEP
- #TSLA
- #TWTR
- AUDCAD
- AUDCHF
- AUDJPY
- AUDUSD
- EURCAD
- EURCHF
- EURGBP
- EURJPY
- EURNZD
- EURRUB
- EURUSD
- GBPAUD
- GBPCHF
- GBPJPY
- GBPUSD
- GOLD
- NZDCAD
- NZDCHF
- NZDJPY
- NZDUSD
- SILVER
- USDCAD
- USDCHF
- USDJPY
- USDRUB
- All
- M5
- M15
- M30
- H1
- D1
- All
- Buy
- Sale
- All
- 1
- 2
- 3
- 4
- 5
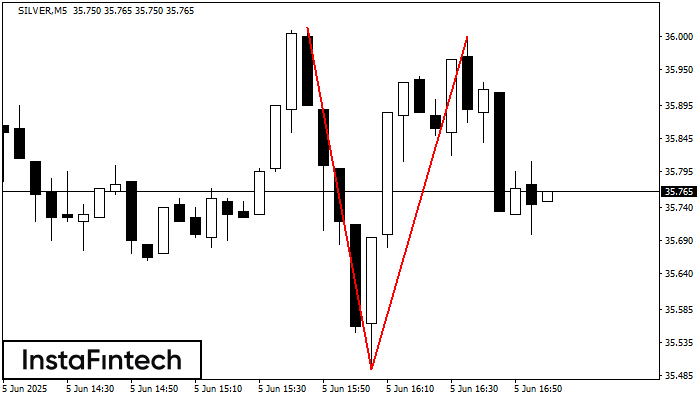
On the chart of SILVER M5 the Double Top reversal pattern has been formed. Characteristics: the upper boundary 36.00; the lower boundary 35.49; the width of the pattern 505 points
The M5 and M15 time frames may have more false entry points.
Open chart in a new window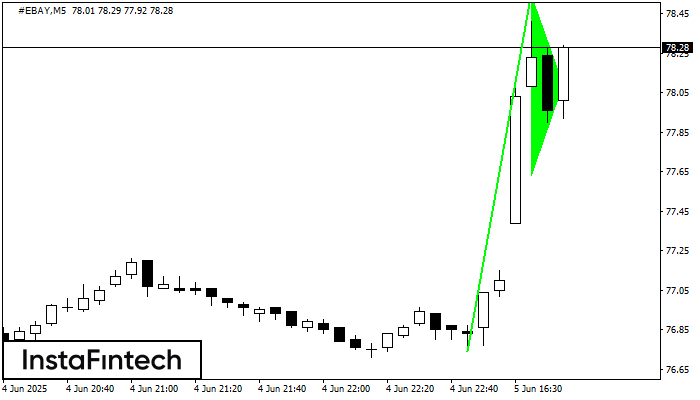
The Bullish pennant pattern is formed on the #EBAY M5 chart. It is a type of the continuation pattern. Supposedly, in case the price is fixed above the pennant’s high
The M5 and M15 time frames may have more false entry points.
Open chart in a new window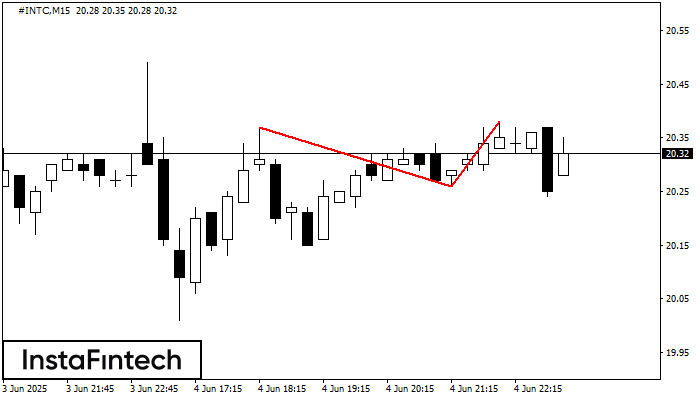
The Double Top pattern has been formed on #INTC M15. It signals that the trend has been changed from upwards to downwards. Probably, if the base of the pattern 20.26
The M5 and M15 time frames may have more false entry points.
Open chart in a new window