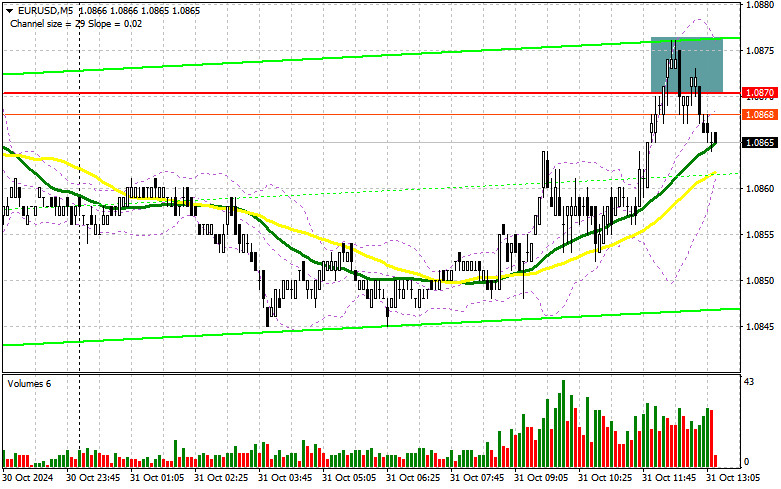
In my morning forecast, I highlighted the 1.0870 level and planned to make market entry decisions based on it. Let's look at the 5-minute chart to analyze what happened. The upward move and subsequent false breakout provided an excellent sell entry point, but it didn't lead to a significant decline. The technical picture for the second half of the day remains unchanged.
For Opening Long Positions on EUR/USD:
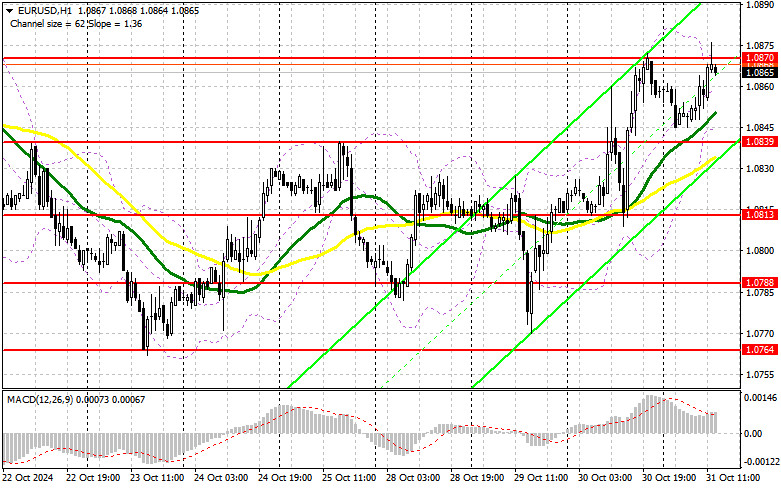
As with yesterday, U.S. statistics will likely spark volatility. Focus on the weekly initial jobless claims data, given the labor market's crucial importance as a factor for the Fed, and the core personal consumption expenditures index, the Fed's preferred inflation metric. Poor data would support new euro purchases to continue the uptrend. If the market reacts bearishly to the data, only a false breakout near 1.0839, where the moving averages are located, would provide a suitable condition for adding long positions to continue the correction. This would open the path to 1.0870, which the euro hasn't managed to break above today. A breakout and retest of this range would confirm a good buy entry, with the next target at 1.0900. The farthest target will be the 1.0927 high, where I plan to take profit. If EUR/USD declines and there is no buying activity around 1.0839 in the second half of the day, the market will likely stabilize. The pair may return to support at 1.0813, creating challenges for buyers. I'll only enter after a false breakout forms there. I plan to open long positions on an immediate rebound from 1.0788, aiming for a 30-35 point upward correction intraday.
For Opening Short Positions on EUR/USD:
Sellers effectively fulfilled their objectives and now look towards the 1.0839 support level. If the pair attempts another rise following weak U.S. data, a false breakout around 1.0870, similar to the earlier scenario, would provide a sell entry point with a target of 1.0839. A breakout and consolidation below this range, followed by a retest from below, would serve as another viable selling scenario, with a target near 1.0813, negating any bullish prospects. The final target will be the 1.0788 area, where I will take profit. If EUR/USD rises in the second half of the day and sellers are absent at 1.0870, buyers may have a chance to establish a larger upward correction. In that case, I'll delay selling until testing the next resistance at 1.0900. I'll also sell there, but only after an unsuccessful consolidation. I plan to open short positions on an immediate rebound from 1.0927, aiming for a 30-35 point downward correction.

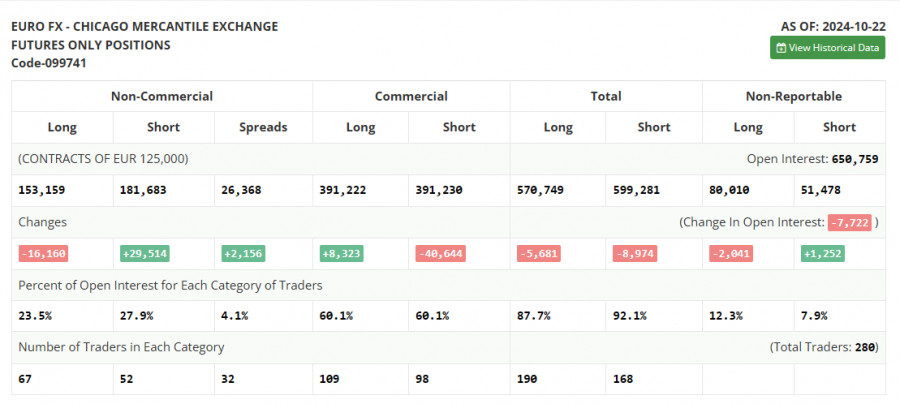
The Commitment of Traders (COT) report for October 22 showed a sharp increase in short positions and a further reduction in long positions. It's evident that traders are banking on the European Central Bank actively cutting interest rates, something European policymakers have been discussing, as well as a more restrained Fed policy in this regard. This week's data on U.S. GDP and the labor market could clarify matters for the market, potentially leading to less pressure to lower rates further, which would strengthen the dollar. According to the COT report, non-commercial long positions fell by 16,160 to 153,159, while non-commercial short positions rose by 29,514 to 181,683, with the gap between long and short positions increasing by 2,156.
Indicator Signals:
Moving Averages
Trading above the 30- and 50-day moving averages indicates further euro growth.
Note: The author's analysis considers moving averages on the H1 hourly chart, which differs from the standard interpretation on the daily D1 chart.
Bollinger Bands
In case of a decline, the lower boundary of the Bollinger Bands around 1.0839 will act as support.
Indicator Descriptions
- Moving Average (MA): Determines the current trend by smoothing volatility and noise. Period – 50, marked in yellow on the chart.
- Moving Average (MA): Determines the current trend by smoothing volatility and noise. Period – 30, marked in green on the chart.
- MACD (Moving Average Convergence/Divergence): Fast EMA – 12 periods, Slow EMA – 26 periods, SMA – 9 periods.
- Bollinger Bands: Period – 20.
- Non-commercial traders: Speculators, such as individual traders, hedge funds, and major institutions using the futures market for speculative purposes.
- Long non-commercial positions: Total open long positions by non-commercial traders.
- Short non-commercial positions: Total open short positions by non-commercial traders.
- Total non-commercial net position: The difference between short and long positions of non-commercial traders.


