EUR/USD 5-Minute Analysis
The EUR/USD currency pair experienced significant growth on Friday. In our fundamental articles, we provided a detailed explanation for this current trend. A few weeks ago, we predicted a correction on the daily timeframe, which now appears to be taking shape. Currently, the market does not even need fresh macroeconomic data to continue buying euros or closing dollar positions. However, when such data comes out and supports the euro, it further accelerates its growth, as was evident on Friday. It's important to note that the Purchasing Managers' Index (PMI) reports alone could not explain a 100-pip rally in the euro; such a market reaction is uncommon, even following more significant events or reports. Upon closer inspection, the European PMIs were not overwhelmingly positive. While three out of four indices showed growth, the manufacturing sectors in Germany and the EU remained below the "waterline," indicating lackluster performance. Therefore, there were no strong grounds for such a significant rally in the euro.
Nonetheless, the pair is in a corrective phase following a 3.5-month decline on the daily timeframe. A move upward by several hundred pips is, therefore, entirely expected. We believe the euro could rise to the 1.0640 level, where the Senkou Span B line is positioned on the daily timeframe.
On Friday, trading signals indicated two possible scenarios involving the level of 1.0461. In the first scenario, the price broke through this level, allowing for a profitable long position as it moved up significantly. In the second scenario, the price rebounded from the same level, nearly reaching the target level of 1.0524. As a result, both transactions proved to be profitable.
COT Report
The latest Commitments of Traders (COT) report, dated January 21, shows that the net position of non-commercial traders has remained bullish for quite some time. However, bears have now taken the lead. Two months ago, there was a significant increase in the number of short positions held by professional traders, causing the net position to turn negative for the first time in a long while. This indicates that the European currency is now being sold more frequently than it is being bought.
We do not see any fundamental factors that would strengthen the European currency. The recent growth of the euro on the weekly timeframe appears to be a simple retracement. While the pair may experience a correction for a few more weeks, the long-term downward trend that has persisted for 16 years is unlikely to be reversed.
At this time, the red and blue lines have crossed, indicating a bearish trend in the market. During the last reporting week, the number of long positions in the "Non-commercial" category increased by 4,900, while the number of short positions rose by 6,900. As a result, the net position decreased by another 2,000 contracts.
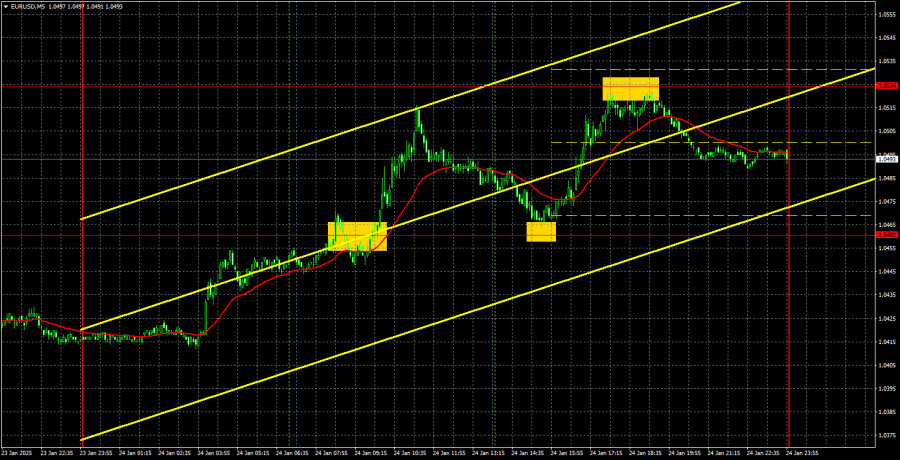
EUR/USD 1-Hour Analysis
On the hourly timeframe, the currency pair has started an upward trend, which appears to be corrective in nature. We believe that a decline will continue in the medium term. The Federal Reserve may reduce interest rates only 1 to 2 times in 2025, a stance that is more hawkish than the market initially expected. This factor, among others, is likely to continue supporting the U.S. dollar in the future. The end of the technical correction can be identified when the price consolidates below the Ichimoku indicator lines and the trendline.
For January 27, we have identified the following trading levels: 1.0124, 1.0195, 1.0269, 1.0340–1.0366, 1.0461, 1.0524, 1.0585, 1.0658–1.0669, 1.0757, 1.0797, 1.0843, as well as the Senkou Span B line at 1.0308 and the Kijun-sen line at 1.0430. Keep in mind that the Ichimoku indicator lines may shift during the day, which should be considered when determining trading signals. Don't forget to set a stop loss to break even if the price moves 15 pips in the desired direction. This will help protect against potential losses if the signal turns out to be false.
On Monday, Christine Lagarde is scheduled to give another speech in the Eurozone, from which we do not expect any significant developments. Since the EUR/USD pair rose sharply on Friday, we anticipate a downward correction on Monday. Overall, this week could be highly volatile, with the direction of price movement potentially changing frequently.
Illustration Explanations:
- Support and Resistance Levels (thick red lines): Thick red lines indicate where movement may come to an end. Please note that these lines are not sources of trading signals.
- Kijun-sen and Senkou Span B Lines: Ichimoku indicator lines transferred from the 4-hour timeframe to the hourly timeframe. These are strong lines.
- Extreme Levels (thin red lines): Thin red lines where the price has previously bounced. These serve as sources of trading signals.
- Yellow Lines: Trendlines, trend channels, or any other technical patterns.
- Indicator 1 on COT Charts: Represents the net position size for each category of traders.