empty
28.02.2025 10:29 AM
BTC/USD Analysis – February 28th

This image is no longer relevant

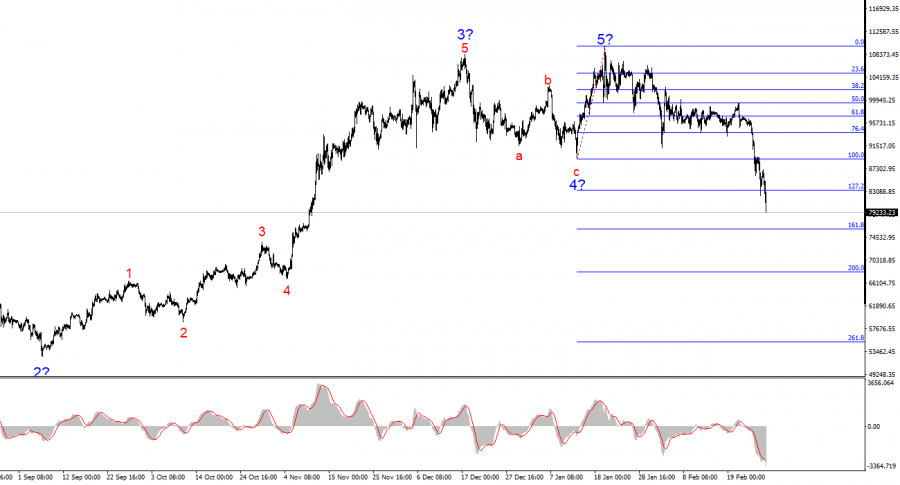
The wave pattern on the 4-hour chart appears quite clear. After a prolonged and complex corrective structure (a-b-c-d-e) from March 14 to August 5, a new impulsive wave began, forming a five-wave pattern. Given the size of wave 1, the fifth wave was likely truncated. Based on this, I did not expect and still do not expect Bitcoin to rise above $110,000–$115,000 in the coming months.

Another key observation is wave 4, which formed a three-wave structure, confirming the validity of the current wave count. Bitcoin's previous rally was fueled by continuous institutional investment, government purchases, and pension fund inflows. However, Donald Trump's policies have driven investors out of the market, and no trend can remain bullish indefinitely. The wave that began on January 20 does not resemble the first impulse wave, indicating that we are dealing with a complex corrective structure that could persist for months.

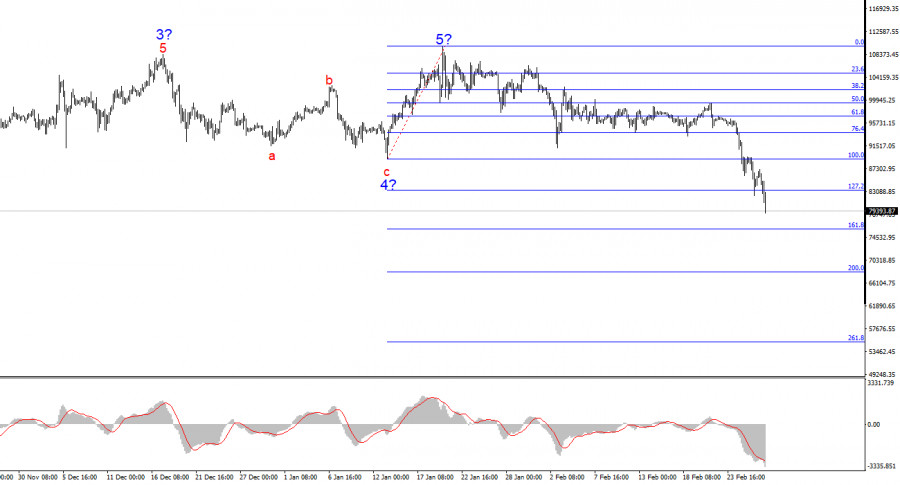
Over the past eight days, Bitcoin has plunged by $18,000, and Friday's session is not over yet. By the end of the day, we could see Bitcoin trading well below $80,000. The market is in a state of near panic, though this crash does not seem to have been triggered by a single event.

I have been warning for weeks that Trump's protectionist policies would not benefit the U.S. economy, the crypto sector, or stock markets. As we can see now, the economy is slowing down, the cryptocurrency market is collapsing, and stock indices, after two years of growth, have also begun to tumble.

There are multiple reasons for this downturn. Trump promised to create a Bitcoin reserve—but did not follow through. He introduced or plans to introduce a series of tariffs on major trading partners. In response, key trading partners are implementing retaliatory tariffs against the U.S. The global economy is slowing down as a result. Trump continues to make unilateral decisions, often disrespecting international leaders.

These factors deter investors from taking risks, and Bitcoin is not considered a safe-haven asset.

Even if Trump's policies are not the direct cause of Bitcoin's crash, I expected a downturn anyway. Bitcoin has been rallying for two years, and historically, its bullish trends rarely exceed that timeframe. The wave structure signaled that wave 5 was truncated and complete, meaning the only logical next step was a decline.

This image is no longer relevant

General Conclusions

Based on my analysis, Bitcoin's rally is over for now. The current trend suggests a prolonged correction, which is why I previously advised against buying cryptocurrencies—and even more so now.

A break below the low of wave 4 confirms that Bitcoin has entered a downward trend, likely a corrective phase. The best strategy remains to look for selling opportunities on lower timeframes. Bitcoin could fall to $76,000 (161.8% Fibonacci level) as soon as today.

On the higher timeframes, we see a five-wave bullish structure that is now transitioning into a corrective or full-fledged bearish trend.

Key Principles of My Analysis:

  1. Wave structures should be simple and clear. Complex patterns are harder to trade and often change.
  2. If there is uncertainty in the market, it's better to stay out.
  3. No movement direction is ever 100% certain. Always use Stop Loss orders.
  4. Wave analysis should be combined with other types of analysis and trading strategies.
Chin Zhao,
Analytical expert of InstaForex
© 2007-2025
Select timeframe
5
min
15
min
30
min
1
hour
4
hours
1
day
1
week
Earn on cryptocurrency rate changes with InstaForex
Download MetaTrader 4 and open your first trade
  • Grand Choice
    Contest by
    InstaForex
    InstaForex always strives to help you
    fulfill your biggest dreams.
    JOIN CONTEST

Recommended Stories

BTC/USD Analysis on April 29, 2025

The wave pattern on the 4-hour chart of the BTC/USD has become somewhat more complex. We observed a corrective downward structure that completed its formation around the $75,000 mark. After

Chin Zhao 11:30 2025-04-29 UTC+2

$200,000 for Bitcoin by Year-End

While Bitcoin is still struggling to break through the $95,000 level — despite all the conditions being in place — Standard Chartered believes that in the second quarter, the leading

Jakub Novak 11:09 2025-04-29 UTC+2

Trading Recommendations for the Cryptocurrency Market on April 29

Bitcoin and Ethereum Buyers Are Trying to Control the Market — and So Far, They're Doing Quite Well However, it's important to note that the longer we remain below $95,000

Miroslaw Bawulski 08:51 2025-04-29 UTC+2

Bitcoin at the Start of a New Rally: When to Expect $120,000 and Beyond

After a week full of turbulence, the cryptocurrency market seems to have taken a deep breath. The Fear and Greed Index has been recorded at 51 — a rare neutral

Ekaterina Kiseleva 01:15 2025-04-29 UTC+2

XRP futures to launch on May 19

Over the weekend, Bitcoin experienced a brief dip but soon returned to the $94,000 level. Ether also faced some pressure, but managed to hold its ground. Surprisingly, XRP saw only

Jakub Novak 16:14 2025-04-28 UTC+2

Trading Recommendations for the Cryptocurrency Market on April 28

Bitcoin is being pressured, but it still holds up quite confidently. After rebounding from the $92,000 mark, the first cryptocurrency returned to the $94,000 area, maintaining good growth prospects

Miroslaw Bawulski 08:19 2025-04-28 UTC+2

Bitcoin – Technical Situation Analysis

Currently, bullish players are attempting to change the situation and achieve bullish optimism for April. Last week, resistance at the final level of the weekly Ichimoku cross (93344) was tested

Evangelos Poulakis 03:51 2025-04-28 UTC+2

Trading Recommendations for the Cryptocurrency Market on April 25

Yesterday's unsuccessful attempt to stay above $94,000 demonstrates that there is still significant buying interest. Ethereum is also holding up quite well, although yesterday's correction during the European session likely

Miroslaw Bawulski 08:56 2025-04-25 UTC+2

Technical Analysis of Intraday Price Movement of Polkadot Cryptocurrency, Friday April 25, 2025.

With the condition of the Stochastic Oscillator indicator which is already above the Overbought level (80) even though it is currently still moving above the WMA (30 Shift 2) which

Arief Makmur 07:02 2025-04-25 UTC+2

Technical Analysis of Intraday Price Movement of Solana Cryptocurrency, Friday April 25, 2025.

Although currently the Solana cryptocurrency is moving in a strengthening condition which is indicated by its price movement moving above the WMA (30 Shift 2) but with the appearance

Arief Makmur 07:02 2025-04-25 UTC+2
Can't speak right now?
Ask your question in the chat.
Widget callback
 

Dear visitor,

Your IP address shows that you are currently located in the USA. If you are a resident of the United States, you are prohibited from using the services of InstaFintech Group including online trading, online transfers, deposit/withdrawal of funds, etc.

If you think you are seeing this message by mistake and your location is not the US, kindly proceed to the website. Otherwise, you must leave the website in order to comply with government restrictions.

Why does your IP address show your location as the USA?

  • - you are using a VPN provided by a hosting company based in the United States;
  • - your IP does not have proper WHOIS records;
  • - an error occurred in the WHOIS geolocation database.

Please confirm whether you are a US resident or not by clicking the relevant button below. If you choose the wrong option, being a US resident, you will not be able to open an account with InstaForex anyway.

We are sorry for any inconvenience caused by this message.