EUR/USD 5-Minute Analysis
The EUR/USD currency pair continued to trade higher on Tuesday, although the growth was not as strong as in previous days. Nevertheless, the euro is steadily rising, despite having few reasons for its increase. We believe that the primary factor behind the euro's growth (or rather, the dollar's decline) is former President Donald Trump and his recent decisions. On Tuesday, it was announced that the U.S. president decided to increase tariffs on Chinese imports to 20% and refused to extend negotiations with Canada and Mexico. As a result, starting yesterday, all imports from these countries are now subject to a 25% tariff. Naturally, Canada and Mexico responded by imposing retaliatory tariffs on U.S. imports.
How did the market react to these developments? The U.S. stock market is noticeably declining, and the American currency is depreciating, even though there are no macroeconomic justifications for this trend. We continue to believe that traders are hesitant to engage with the U.S. dollar due to President Trump's actions. There was a formal reason to buy the euro on Tuesday, as the EU unemployment rate fell from 6.3% to 6.2%. However, this was only a superficial reason, much like the reports from Monday.
On the 5-minute timeframe, four trading signals were generated yesterday, but none were particularly reliable. The pair is experiencing volatility, and the market is in an emotional state, constantly shifting between buying and selling. As a result, none of the signals provided profitable opportunities. The euro remains close to the upper boundary of a flat range on the daily timeframe. We believe it is best to stay out of the market during such periods.
COT Report
The latest Commitment of Traders (COT) report is dated February 25. The illustration above clearly shows that non-commercial traders have maintained a bullish net position for an extended period; however, bears have now taken the lead. Three months ago, professional traders significantly increased their short positions, causing the net position to turn negative for the first time in a while. This indicates that the euro is currently being sold more often than it is being bought, and bearish sentiment continues to dominate the market.
There are still no fundamental factors supporting a strengthening of the euro. The recent upward movement observed on the weekly timeframe is minimal and appears to be merely a technical correction. The long-term downward trend, which has persisted for 16 years, remains intact, even if the pair experiences correction for several more weeks or months.
At present, the red and blue lines have crossed and reversed their positions relative to each other, signaling a bearish trend in the market. During the last reporting week, long positions among the "non-commercial" group increased by 12,400, while short positions decreased by 13,600. Consequently, the net position rose by 26,000 contracts; however, this change has not yet influenced the overall market sentiment.
EUR/USD 1-Hour Analysis
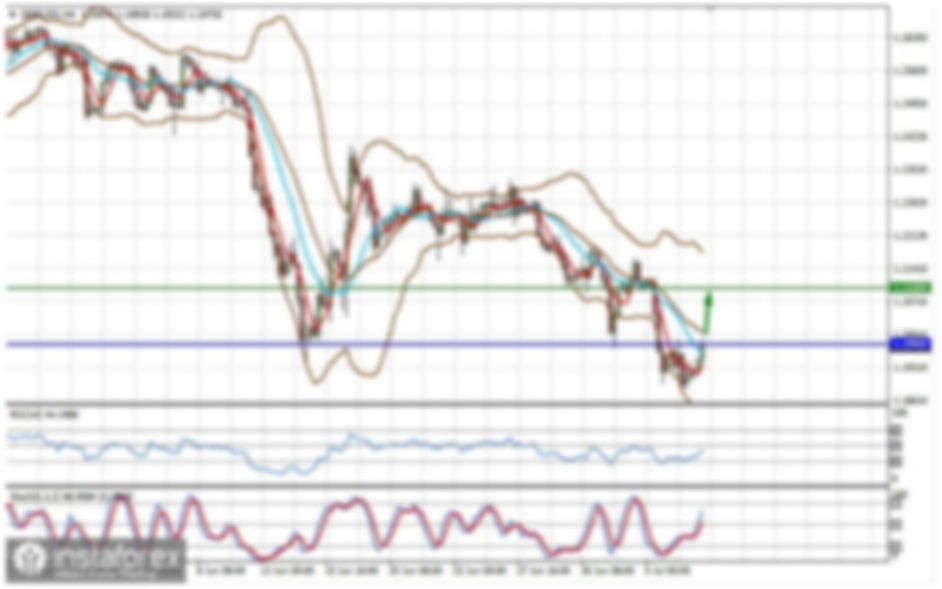
In the hourly timeframe, the pair began the expected decline, but Trump's actions disrupted the market, and the euro started rising again—rising hesitantly, without a clear reason, but rising nonetheless. We believe a decline will resume in the medium term due to the divergence in monetary policies between the European Central Bank and the Federal Reserve. However, in the short term, we may see one or two more upward trends, as a correction on the daily timeframe could take a long time and become quite complex. There are still no strong fundamental reasons for the euro's growth—it remains 80% technical or emotional.
For March 5, the key trading levels are 1.0124, 1.0195, 1.0269, 1.0340-1.0366, 1.0461, 1.0524, 1.0585, 1.0658-1.0669, 1.0757, 1.0797, 1.0843, as well as the Senkou Span B (1.0464) and Kijun-sen (1.0458) lines. The Ichimoku indicator lines may shift throughout the day, which should be considered when determining trading signals. Don't forget to set a Stop Loss at breakeven if the price moves 15 pips in the right direction to protect against potential losses if a signal turns out to be false.
On Wednesday, the Eurozone, Germany, and the U.S. will publish service sector PMI indices. The U.S. will also release the ADP report on private-sector employment. The most important indicator is the ISM index, but each report could influence euro buying.
Illustration Explanations:
- Support and Resistance Levels (thick red lines): Thick red lines indicate where movement may come to an end. Please note that these lines are not sources of trading signals.
- Kijun-sen and Senkou Span B Lines: Ichimoku indicator lines transferred from the 4-hour timeframe to the hourly timeframe. These are strong lines.
- Extreme Levels (thin red lines): Thin red lines where the price has previously bounced. These serve as sources of trading signals.
- Yellow Lines: Trendlines, trend channels, or any other technical patterns.
- Indicator 1 on COT Charts: Represents the net position size for each category of traders.