signal strength 1 of 5
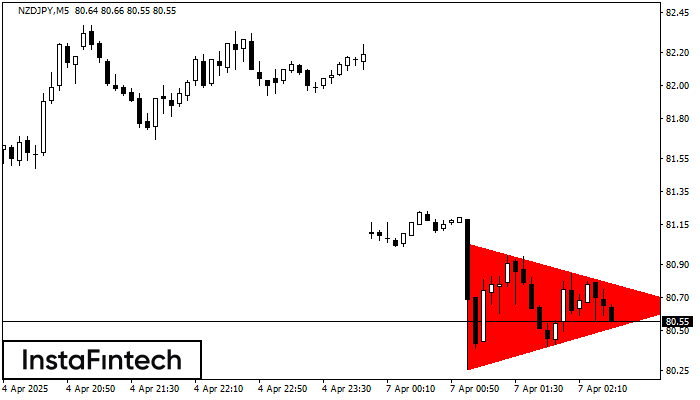
According to the chart of M5, NZDJPY formed the Bearish Symmetrical Triangle pattern. Trading recommendations: A breach of the lower border 80.26 is likely to encourage a continuation of the downward trend.
The M5 and M15 time frames may have more false entry points.
- All
- Double Top
- Flag
- Head and Shoulders
- Pennant
- Rectangle
- Triangle
- Triple top
- All
- #AAPL
- #AMZN
- #Bitcoin
- #EBAY
- #FB
- #GOOG
- #INTC
- #KO
- #MA
- #MCD
- #MSFT
- #NTDOY
- #PEP
- #TSLA
- #TWTR
- AUDCAD
- AUDCHF
- AUDJPY
- AUDUSD
- EURCAD
- EURCHF
- EURGBP
- EURJPY
- EURNZD
- EURRUB
- EURUSD
- GBPAUD
- GBPCHF
- GBPJPY
- GBPUSD
- GOLD
- NZDCAD
- NZDCHF
- NZDJPY
- NZDUSD
- SILVER
- USDCAD
- USDCHF
- USDJPY
- USDRUB
- All
- M5
- M15
- M30
- H1
- D1
- All
- Buy
- Sale
- All
- 1
- 2
- 3
- 4
- 5

Trên biểu đồ của công cụ giao dịch #Bitcoin M15, mô hình Đỉnh ba báo hiệu sự thay đổi xu hướng đã hình thành. Có thể sau khi hình thành
Khung thời gian M5 và M15 có thể có nhiều điểm vào lệnh sai hơn.
Open chart in a new window
Mô hình đảo chiều Đỉnh đôi đã được hình thành trên #Bitcoin M30. Đặc điểm: ranh giới trên 104800.13; ranh giới dưới 104215.56; chiều rộng của mô hình là 64024
Open chart in a new window
Theo biểu đồ của M5, #Bitcoin đã hình thành Hình chữ nhật tăng, cái mà là mô hình của sự tiếp tục xu hướng. Mô hình này được chứa trong
Khung thời gian M5 và M15 có thể có nhiều điểm vào lệnh sai hơn.
Open chart in a new window