signal strength 3 of 5
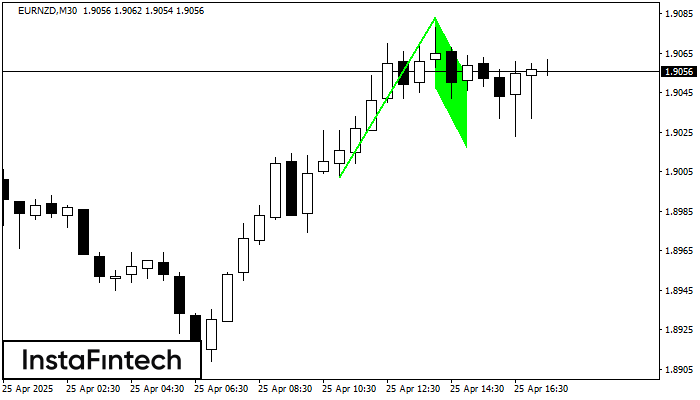
The Bullish Flag pattern has been formed on the chart EURNZD M30 which signals that the upward trend will continue. Signals: а break of the peak at 1.9083 may push the price higher, and the rise will be the projection of the pole.
See Also
- All
- Double Top
- Flag
- Head and Shoulders
- Pennant
- Rectangle
- Triangle
- Triple top
- All
- #AAPL
- #AMZN
- #Bitcoin
- #EBAY
- #FB
- #GOOG
- #INTC
- #KO
- #MA
- #MCD
- #MSFT
- #NTDOY
- #PEP
- #TSLA
- #TWTR
- AUDCAD
- AUDCHF
- AUDJPY
- AUDUSD
- EURCAD
- EURCHF
- EURGBP
- EURJPY
- EURNZD
- EURRUB
- EURUSD
- GBPAUD
- GBPCHF
- GBPJPY
- GBPUSD
- GOLD
- NZDCAD
- NZDCHF
- NZDJPY
- NZDUSD
- SILVER
- USDCAD
- USDCHF
- USDJPY
- USDRUB
- All
- M5
- M15
- M30
- H1
- D1
- All
- Buy
- Sale
- All
- 1
- 2
- 3
- 4
- 5
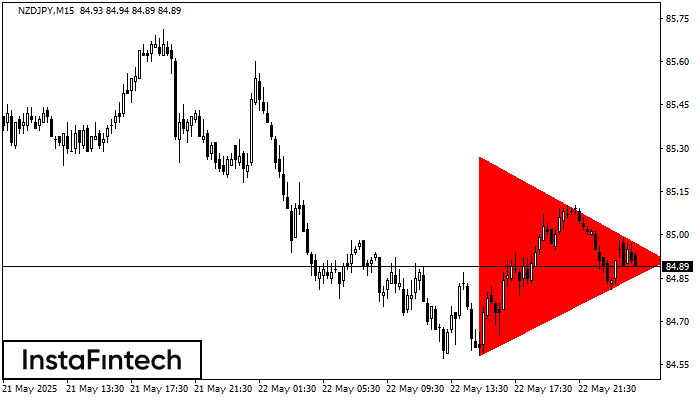
According to the chart of M15, NZDJPY formed the Bearish Symmetrical Triangle pattern. This pattern signals a further downward trend in case the lower border 84.58 is breached. Here
The M5 and M15 time frames may have more false entry points.
Open chart in a new window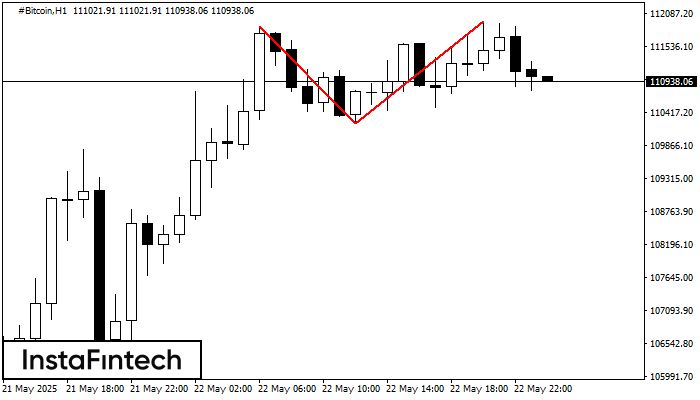
On the chart of #Bitcoin H1 the Double Top reversal pattern has been formed. Characteristics: the upper boundary 111951.72; the lower boundary 110239.46; the width of the pattern 171226 points
Open chart in a new window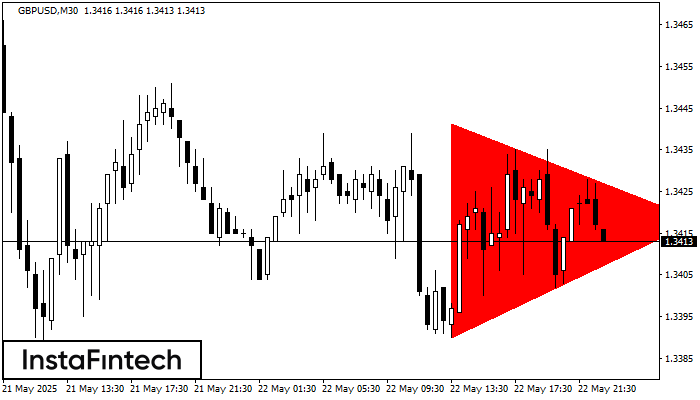
According to the chart of M30, GBPUSD formed the Bearish Symmetrical Triangle pattern. This pattern signals a further downward trend in case the lower border 1.3390 is breached. Here
Open chart in a new window