

signal strength 1 of 5
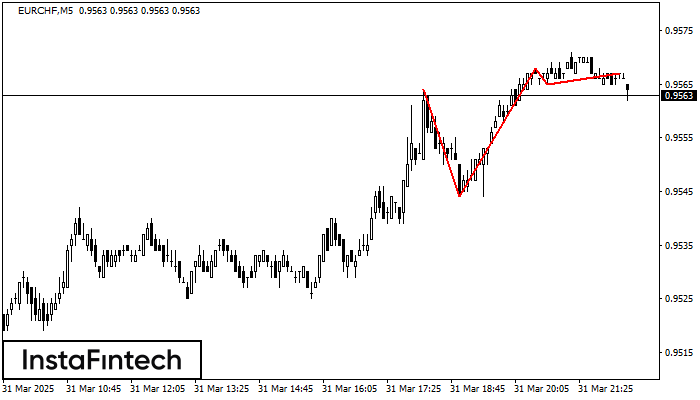
The Triple Top pattern has formed on the chart of the EURCHF M5 trading instrument. It is a reversal pattern featuring the following characteristics: resistance level -3, support level -21, and pattern’s width 20. Forecast If the price breaks through the support level 0.9544, it is likely to move further down to 0.9553.
The M5 and M15 time frames may have more false entry points.
See Also
- All
- Double Top
- Flag
- Head and Shoulders
- Pennant
- Rectangle
- Triangle
- Triple top
- All
- #AAPL
- #AMZN
- #Bitcoin
- #EBAY
- #FB
- #GOOG
- #INTC
- #KO
- #MA
- #MCD
- #MSFT
- #NTDOY
- #PEP
- #TSLA
- #TWTR
- AUDCAD
- AUDCHF
- AUDJPY
- AUDUSD
- EURCAD
- EURCHF
- EURGBP
- EURJPY
- EURNZD
- EURRUB
- EURUSD
- GBPAUD
- GBPCHF
- GBPJPY
- GBPUSD
- GOLD
- NZDCAD
- NZDCHF
- NZDJPY
- NZDUSD
- SILVER
- USDCAD
- USDCHF
- USDJPY
- USDRUB
- All
- M5
- M15
- M30
- H1
- D1
- All
- Buy
- Sale
- All
- 1
- 2
- 3
- 4
- 5
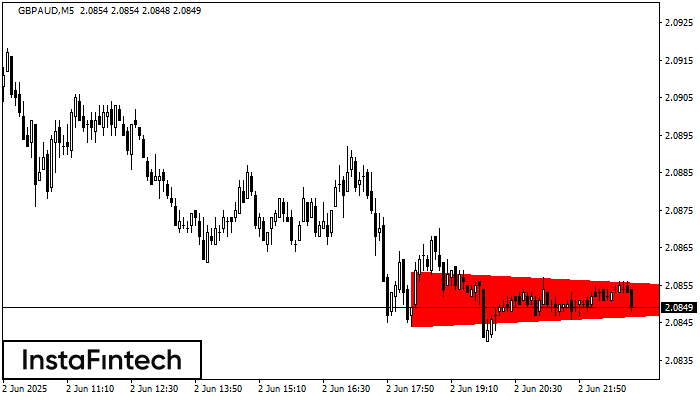
According to the chart of M5, GBPAUD formed the Bearish Symmetrical Triangle pattern. Description: The lower border is 2.0844/2.0851 and upper border is 2.0859/2.0851. The pattern width is measured
The M5 and M15 time frames may have more false entry points.
Open chart in a new window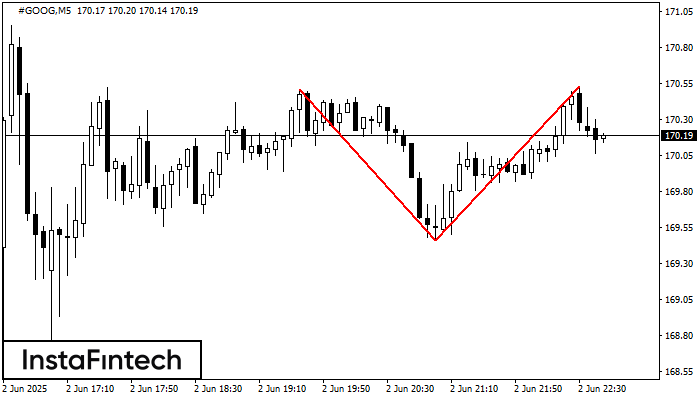
On the chart of #GOOG M5 the Double Top reversal pattern has been formed. Characteristics: the upper boundary 170.53; the lower boundary 169.46; the width of the pattern 107 points
The M5 and M15 time frames may have more false entry points.
Open chart in a new window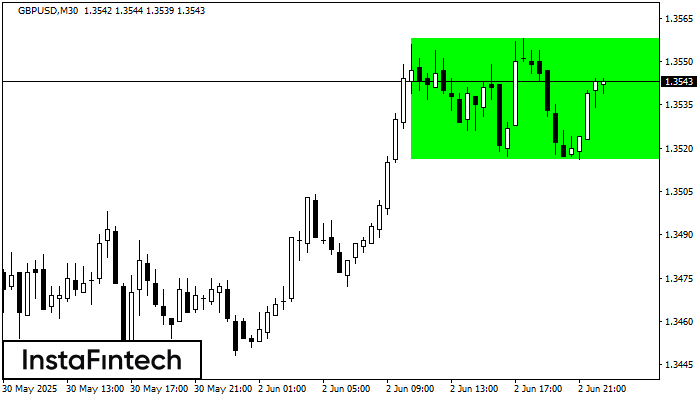
According to the chart of M30, GBPUSD formed the Bullish Rectangle. This type of a pattern indicates a trend continuation. It consists of two levels: resistance 1.3558 and support 1.3516
Open chart in a new window


