signal strength 1 of 5
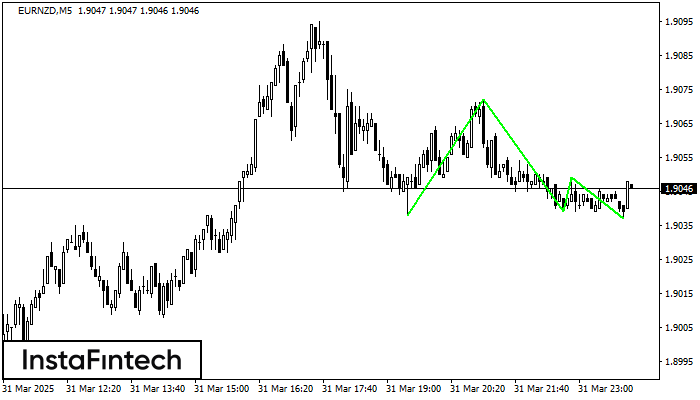
The Triple Bottom pattern has been formed on EURNZD M5. It has the following characteristics: resistance level 1.9072/1.9049; support level 1.9038/1.9037; the width is 34 points. In the event of a breakdown of the resistance level of 1.9072, the price is likely to continue an upward movement at least to 1.9054.
The M5 and M15 time frames may have more false entry points.
- All
- Double Top
- Flag
- Head and Shoulders
- Pennant
- Rectangle
- Triangle
- Triple top
- All
- #AAPL
- #AMZN
- #Bitcoin
- #EBAY
- #FB
- #GOOG
- #INTC
- #KO
- #MA
- #MCD
- #MSFT
- #NTDOY
- #PEP
- #TSLA
- #TWTR
- AUDCAD
- AUDCHF
- AUDJPY
- AUDUSD
- EURCAD
- EURCHF
- EURGBP
- EURJPY
- EURNZD
- EURRUB
- EURUSD
- GBPAUD
- GBPCHF
- GBPJPY
- GBPUSD
- GOLD
- NZDCAD
- NZDCHF
- NZDJPY
- NZDUSD
- SILVER
- USDCAD
- USDCHF
- USDJPY
- USDRUB
- All
- M5
- M15
- M30
- H1
- D1
- All
- Buy
- Sale
- All
- 1
- 2
- 3
- 4
- 5
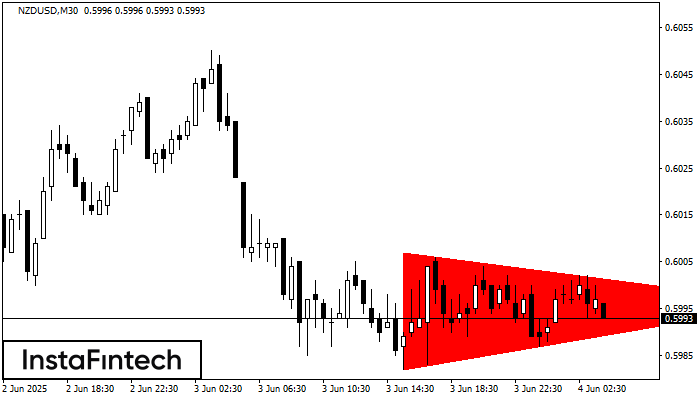
According to the chart of M30, NZDUSD formed the Bearish Symmetrical Triangle pattern. Description: The lower border is 0.5982/0.5996 and upper border is 0.6007/0.5996. The pattern width is measured
Open chart in a new window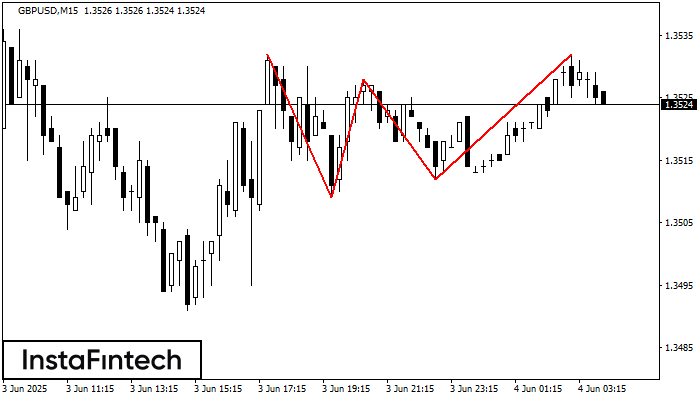
The Triple Top pattern has formed on the chart of the GBPUSD M15 trading instrument. It is a reversal pattern featuring the following characteristics: resistance level 0, support level -3
The M5 and M15 time frames may have more false entry points.
Open chart in a new window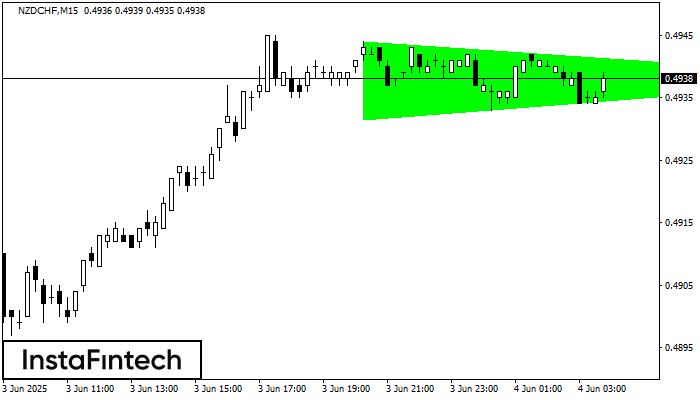
According to the chart of M15, NZDCHF formed the Bullish Symmetrical Triangle pattern, which signals the trend will continue. Description. The upper border of the pattern touches the coordinates 0.4944/0.4938
The M5 and M15 time frames may have more false entry points.
Open chart in a new window