empty
28.11.2023 10:11 AM
EUR/USD and GBP/USD: Trading plan for beginner traders on November 28, 2023

Details of the Economic Calendar on November 27

On Monday, the macroeconomic calendar was almost empty, and the only thing worth noting was the data on new home sales in the United States, where a decline of 5.6% was recorded. This indicator turned out to be negative for the country's economy.

Analysis of Trading Charts from November 27

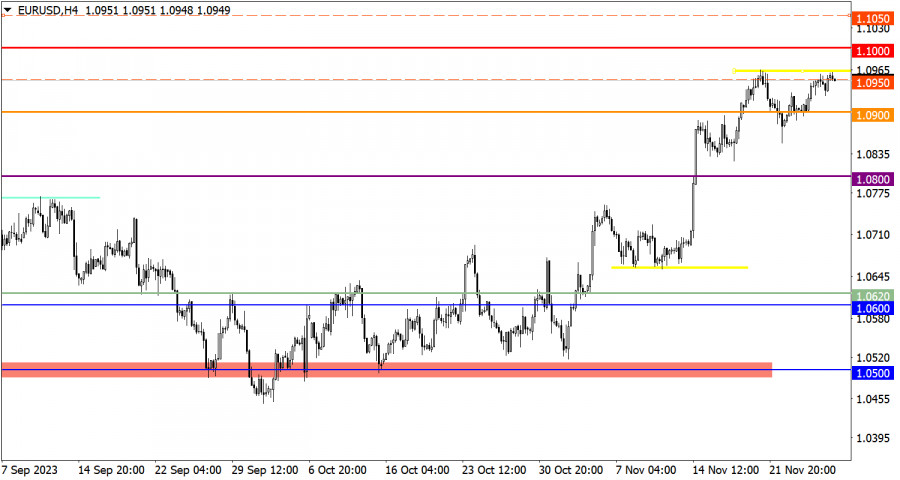
The EUR/USD currency pair approached the local high of the current upward cycle. This move led to a slight reduction in the volume of long positions, but the upward trend is still maintained in the market.

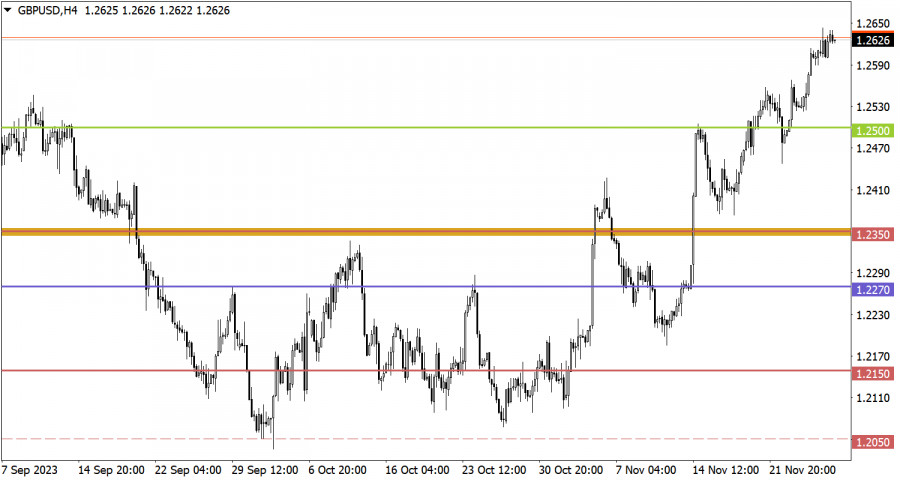
The GBP/USD pair again updated the local high in the current upward cycle. Since the beginning of November, the value of the British pound has strengthened by more than 4%, which is about 500 points.

This image is no longer relevant

Economic Calendar on November 28

Today, data on the House Price Index in the United States will be released, which is expected to rise by 0.4% (month-on-month). Considering the significant decrease in sales volumes, especially in the secondary market, the price increase may be considered more as a negative factor, hindering the real estate market's recovery. According to this logic, the U.S. dollar may come under pressure from sellers.

EUR/USD Trading Plan for November 28

In the current situation, price stabilization above the level of 1.0950 could well initiate an update of the local high. In perspective, such a movement may strengthen the euro towards the range of 1.1000/1.1050.

This image is no longer relevant

GBP/USD Trading Plan for November 28

Subsequent growth could well trigger a price movement towards the resistance level of 1.2700. It is worth noting that an increasing level of overbought conditions is already observed in the market, which could negatively impact the volume of long positions in the future.

This image is no longer relevant

What's on the charts

The candlestick chart type is white and black graphic rectangles with lines above and below. With a detailed analysis of each individual candle, you can see its characteristics relative to a particular time frame: opening price, closing price, intraday high and low.

Horizontal levels are price coordinates, relative to which a price may stop or reverse its trajectory. In the market, these levels are called support and resistance.

Circles and rectangles are highlighted examples where the price reversed in history. This color highlighting indicates horizontal lines that may put pressure on the asset's price in the future.

The up/down arrows are landmarks of the possible price direction in the future.

Gven Podolsky,
Analytical expert of InstaForex
© 2007-2025
EUR
Summary
Buy
Urgency
1 day
Analytic
Vladislav Tukhmenev
Start trade
Earn on cryptocurrency rate changes with InstaForex
Download MetaTrader 4 and open your first trade
  • Grand Choice
    Contest by
    InstaForex
    InstaForex always strives to help you
    fulfill your biggest dreams.
    JOIN CONTEST

Recommended Stories

How to Trade the GBP/USD Pair on April 10? Simple Tips and Trade Analysis for Beginners

Analysis of Wednesday's Trades 1H Chart of GBP/USD The GBP/USD pair spent the past 24 hours rising, then falling again, and then rising again. As before, it's impossible to identify

Paolo Greco 06:49 2025-04-10 UTC+2

How to Trade the EUR/USD Pair on April 10? Simple Tips and Trade Analysis for Beginners

Analysis of Wednesday's Trades 1H Chart of EUR/USD The EUR/USD currency pair showed strong growth and decline on Wednesday. Lately, both moves have been triggered by Donald Trump. First, news

Paolo Greco 06:49 2025-04-10 UTC+2

Trading Recommendations and Analysis for GBP/USD on April 10: Who Cares About U.S. Inflation Right Now?

On Wednesday, the GBP/USD currency pair showed mixed movements throughout the day but generally maintained a downward trend — if we can even call the current behavior a "trend." There

Paolo Greco 03:21 2025-04-10 UTC+2

Trading Recommendations and Analysis for EUR/USD on April 10: 500% Tariffs for China!

On Wednesday, the EUR/USD currency pair moved exactly as expected — in several aspects. First, let's start with the "triangle" pattern we discussed yesterday. We warned that such formations often

Paolo Greco 03:21 2025-04-10 UTC+2

How to Trade the GBP/USD Pair on April 9? Simple Tips and Trade Analysis for Beginners

Analysis of Tuesday's Trades 1H Chart of GBP/USD On Tuesday, the GBP/USD pair traded with a slight upward bias. There were no major news events throughout the day, and only

Paolo Greco 06:47 2025-04-09 UTC+2

How to Trade the EUR/USD Pair on April 9? Simple Tips and Trade Analysis for Beginners

Analysis of Tuesday's Trades 1H Chart of EUR/USD On Tuesday, the EUR/USD currency pair traded with low volatility throughout the day, mostly moving sideways. However, as we warned, this

Paolo Greco 06:47 2025-04-09 UTC+2

Trading Recommendations and Analysis for GBP/USD on April 9: The Pound Is Stuck in One Place

The GBP/USD currency pair made a slight upward correction on Tuesday but failed to break through the nearest resistance level. Thus, after a 500-pip decline, we have seen virtually

Paolo Greco 02:55 2025-04-09 UTC+2

Trading Recommendations and Analysis for EUR/USD on April 9: The Market Is Getting Ready to Break Out Again

The EUR/USD currency pair calmed down slightly on Tuesday, but the technical picture does not promise anything good—nor does the fundamental background. Let's start with the technicals. A classic "bullish

Paolo Greco 02:55 2025-04-09 UTC+2

GBP/USD: Trading plan for the U.S. session on April 8th (analysis of the morning trades)

In my morning forecast, I focused on the 1.2754 level and planned to make trading decisions from it. Let's look at the 5-minute chart and examine what happened there

Miroslaw Bawulski 19:33 2025-04-08 UTC+2

EUR/USD: Trading plan for the U.S. session on April 8th (analysis of the morning trades)

In my morning forecast, I focused on the 1.0987 level and planned to make trading decisions from it. Let's look at the 5-minute chart and see what happened there

Miroslaw Bawulski 19:29 2025-04-08 UTC+2
Can't speak right now?
Ask your question in the chat.
Widget callback
 

Dear visitor,

Your IP address shows that you are currently located in the USA. If you are a resident of the United States, you are prohibited from using the services of InstaFintech Group including online trading, online transfers, deposit/withdrawal of funds, etc.

If you think you are seeing this message by mistake and your location is not the US, kindly proceed to the website. Otherwise, you must leave the website in order to comply with government restrictions.

Why does your IP address show your location as the USA?

  • - you are using a VPN provided by a hosting company based in the United States;
  • - your IP does not have proper WHOIS records;
  • - an error occurred in the WHOIS geolocation database.

Please confirm whether you are a US resident or not by clicking the relevant button below. If you choose the wrong option, being a US resident, you will not be able to open an account with InstaForex anyway.

We are sorry for any inconvenience caused by this message.