Tuesday's premarket opens with uncertainty, a state that often precedes a storm rather than calm on Wall Street. The S&P 500 futures are sliding toward 5,420 after a strong Monday session, once again led by tech giants.
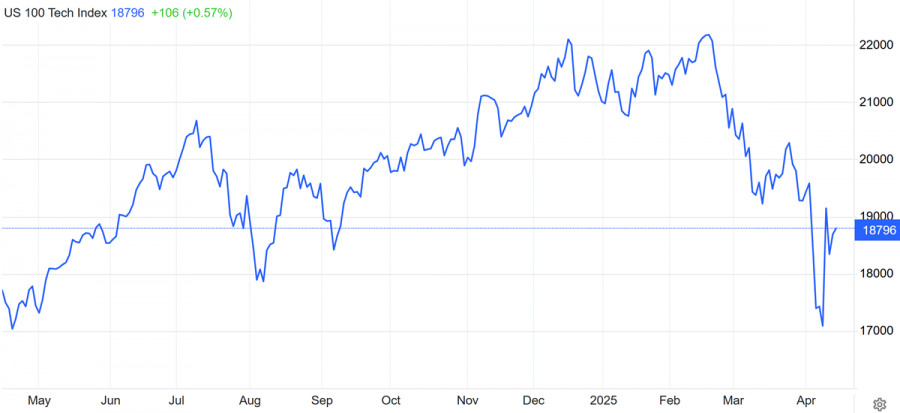
The Nasdaq 100 is hovering near 18,890, balancing between optimism over tariff rollbacks and fears of renewed trade escalation. Investors find themselves caught in a classic trap: short-term euphoria and fundamental risks that cannot be ignored.
At first glance, the market seems to have caught a break: the removal of tariffs on smartphones and chips, a boost from Trump's comments on auto tariffs, and a 0.4% premarket rise in key indices. Yet an experienced investor will not be swayed by appearances alone.
These tariff relaxations are only a temporary pause, not a strategic shift. The White House is once again playing its game, when one sector receives relief, another, namely semiconductors and pharmaceuticals, faces potential national security investigations. In other words, new sanctions could hit at any moment.
Layered on top is earnings season, which is moving from anticipation into substance. Johnson & Johnson, Bank of America, Citigroup, and PNC Financial are not just large companies. They serve as indicators of consumer behavior, credit conditions, and the overall health of the economy. Early earnings will set the tone. Expectations are high, but a single disappointment could lead to a sharp pullback.
The S&P 500 is trading near the 5,420 level, which marks significant resistance within the expanded upward channel formed since late October 2023. The index is approaching overbought territory on the RSI (above 70 on the daily chart), and divergence is forming as prices are hitting new highs, but oscillators are not.
This is not yet a reversal, but it is a warning sign. Immediate support is found between 5,350 and 5,320. A break below that opens the path toward 5,250, which is the lower boundary of the medium-term trend.
As for the Nasdaq 100, it is showing a slightly more aggressive movement. The level of 18,890 is the ceiling of the current consolidation. An attempt to break through 18,900 could trigger a move toward 19,200.
However, the technical pattern still leans toward a correction: volumes are falling, candlestick formations are weakening, and the MACD on daily charts is close to crossing the signal line downward. Support lies at 18,550 and 18,200. A break of the first level would already signal profit-taking across many tech positions.
The sentiment is bullish, but fragile. The moment fundamentals stop supporting the optimism, technical factors will take over. Those who fail to lock in gains near the highs might end up as the last passengers on a departing train.
Bank of America and Citigroup: walking line between stability and concern
Bank of America and Citigroup are among those banks whose earnings are always read between the lines. Both serve as barometers for credit activity, consumer confidence, and margins in an environment of shifting interest rates. And right now, as the Federal Reserve pauses its rate-hiking cycle and the market anticipates possible cuts by summer, banking profitability is under pressure.
Bank of America
BofA traditionally benefits from a high-rate environment thanks to its strong retail client base and broad deposit network. However, this quarter is expected to bring a decline in net interest margin.
A strong labor market and rising consumer spending support fee income, but margin pressure from slowing mortgage and auto lending will be noticeable.
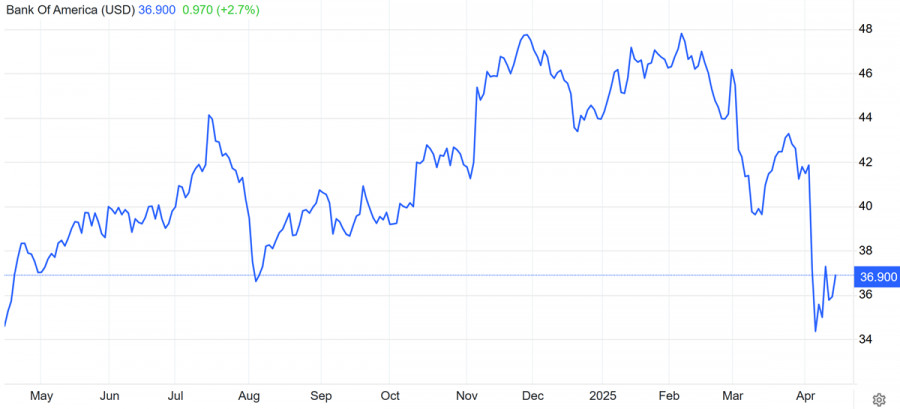
From a technical point of view, BAC shares are trading near $37, approaching key resistance at $38.50. With strong earnings and resilient profits, the stock could easily break $39 and move toward the $41–42 area, which saw peaks in early 2023.
If results disappoint, a pullback to $35.70 is likely, with a possible test of $34.30, a key support level in the current uptrend.
With neutral or mildly positive results, we may expect moderate growth. In case of a miss, there will be a 3–5% short-term decline.
Citigroup
Citigroup is a more complex entity. Unlike BAC, Citi is more globalized and sensitive to international trade flows and market volatility. The key intrigue of the report lies in the performance of the institutional and corporate banking divisions amid instability in Europe and Asia.
Investors are also watching Citi's restructuring efforts, including divestments and focus on core business areas. Any positive signals here may be seen as a turning point.
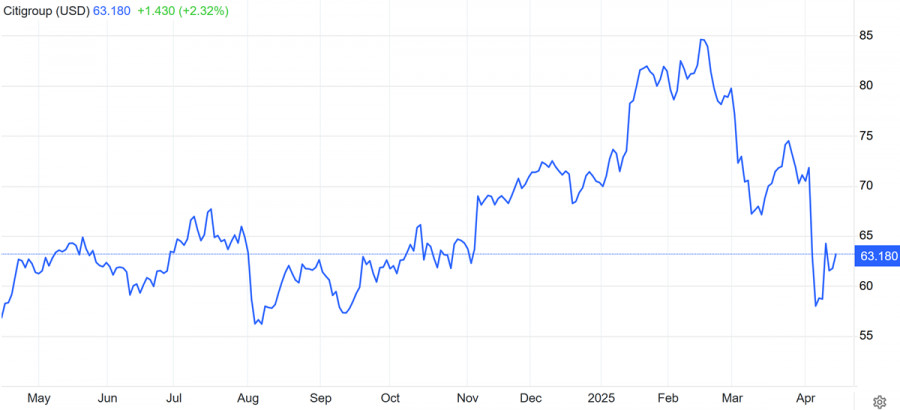
From a technical point of view, Citi stock is stuck between $60 and $63. Strong earnings and signs of operational efficiency improvements could push the stock to $65 and beyond, with a target of $68.
If the report reveals weakness in international segments or falling fee income, the stock may drop to $58, followed by a test of $55.
High sensitivity to detail. Positive news may cause a 5–6% jump. If results disappoint, a sharp 6–8% drop could follow, especially if the restructuring shows little progress.


