empty
24.04.2025 10:34 AM
Trump Eases Pressure on China

This image is no longer relevant

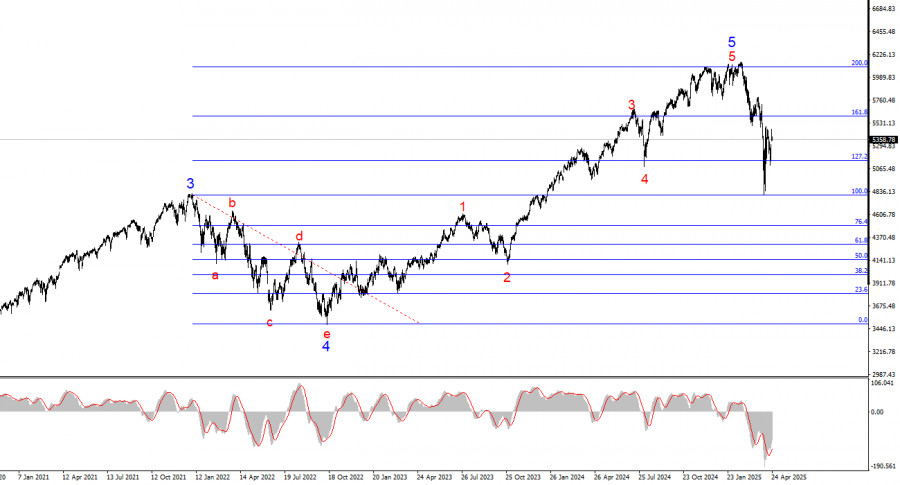
The wave pattern on the 24-hour chart for #SPX is generally clear. The global five-wave structure doesn't even fit on the terminal screen at the smallest scale. In simple terms, U.S. stock indices had been rising for a very long time—but we know that trends alternate. At this point, the upward trend segment appears to be complete. The instrument has made four unsuccessful attempts to break through the 6,093 level, which corresponds to 200.0% Fibonacci from wave 4. In my view, we will soon see the continuation of a corrective wave series. The U.S. stock market had been overheated for too long, and Trump triggered a chain reaction.

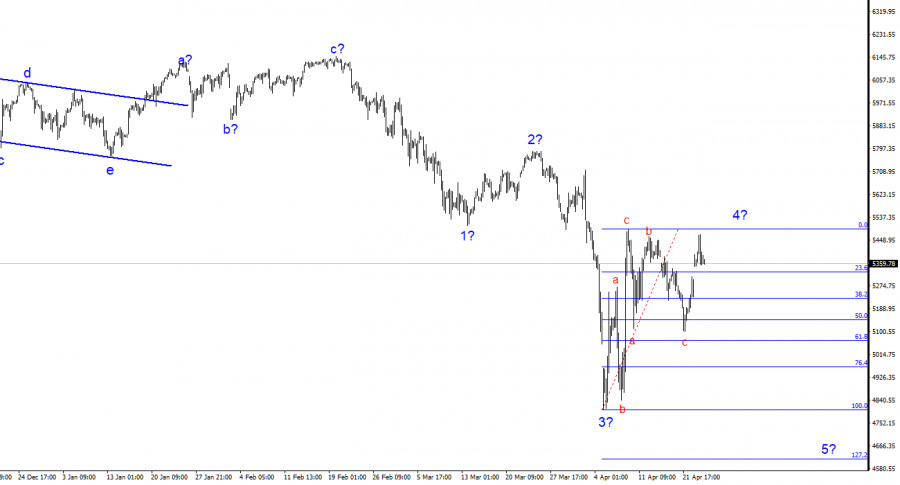
Switching to the 4-hour chart (image above), we can observe the development of a new downward trend segment, which could be quite extensive. The fifth wave is still missing from the structure, so I believe the decline in the S&P 500 index is not yet over. It's also important to keep in mind that any new tariffs introduced by Trump—or retaliatory tariffs imposed on the U.S.—could logically trigger new rounds of sell-offs in the U.S. stock market. Currently, the presumed wave 4 is still forming and may turn out to be quite complex in its internal structure.

The #SPX has recovered sharply, but the downtrend formation is still in progress. We are now witnessing the construction of a complex corrective structure within the presumed wave 4. I see no signs of a trend reversal at this time.

The recent recovery in the S&P 500 is primarily due to Trump's softened rhetoric regarding the trade war. Recall that a couple of weeks ago, Trump announced a 90-day grace period for 75 countries previously hit with import tariffs. Earlier this week, the U.S. President stated that tariffs on China would be reduced. It's still unclear by how much, when, or under what conditions, but the tone toward China—and many other countries—has clearly shifted.

The market sensed that the harshest trade war scenario may be avoided, and stopped selling off U.S. stocks. However, it's too early to speak of full de-escalation, as Trump is not planning to repeal all tariffs. I also doubt that every country will succeed in reaching trade deals with the U.S. I'm particularly concerned about the outcomes for the European Union and China, where negotiations remain extremely difficult.

As such, the recent market recovery is quite logical, but further growth will depend on positive news related to trade tensions. If such news is limited, continued growth in the S&P 500 becomes questionable.

This image is no longer relevant

Summary

Based on the analysis of #SPX, I conclude that the upward trend segment has ended. Trump continues to make decisions that threaten the stability of the U.S. economy and American corporations (e.g., trade wars, tariffs, import restrictions, and export controls), which is why we are now observing the start of a new downward trend. The "bubble" in the U.S. stock market had been inflating for years—and Trump has popped it.

The 4-hour chart also supports the likelihood of further declines. At this point, we expect the formation of wave 5, which implies another leg down, targeting the area around 4,614.

On the higher time frame, the wave structure is much clearer: a clean five-wave structure, including a five-wave substructure within wave 5. The upward trend segment is complete. Therefore, I would prepare for a new long-term downward segment, which is already underway.

Core Principles of My Analysis:

  1. Wave structures should be simple and clear. Complex structures are difficult to trade and often shift unpredictably.
  2. If there is uncertainty in the market, it's better to stay out.
  3. There is never 100% certainty in any trend direction. Always use Stop Loss orders.
  4. Elliott Wave analysis can be effectively combined with other forms of analysis and trading strategies.
Chin Zhao,
Analytical expert of InstaForex
© 2007-2025
Select timeframe
5
min
15
min
30
min
1
hour
4
hours
1
day
1
week
Earn on cryptocurrency rate changes with InstaForex
Download MetaTrader 4 and open your first trade
  • Grand Choice
    Contest by
    InstaForex
    InstaForex always strives to help you
    fulfill your biggest dreams.
    JOIN CONTEST

Recommended Stories

Stock Market on May 30th: S&P 500 and NASDAQ Resume Decline

At the close of the latest regular session, U.S. stock indices posted modest gains. The S&P 500 rose by 0.40%, the Nasdaq 100 added 0.39%, and the Dow Jones Industrial

Jakub Novak 10:45 2025-05-30 UTC+2

US Market: Court overturns trump tariffs

S&P 500 Market overview on 29.05 A federal court in the US has struck down all of former President Trump's trade tariffs. Major US indices on Wednesday: Dow -0.6%, NASDAQ

Jozef Kovach 12:53 2025-05-29 UTC+2

Stock Market on May 29th: S&P 500 and Nasdaq Pause Their Rally

At the close of the most recent regular trading session, U.S. stock indices posted modest losses. The S&P 500 declined by 0.56%, the Nasdaq 100 fell by 0.71%

Jakub Novak 11:04 2025-05-29 UTC+2

Navigating dollar surge and tech turmoil: key entry points for traders

Volatility has returned to financial markets. The dollar staged a sharp rally, driving down the yen, euro, and Swiss franc, but beneath the surface lies a web of unsettling signals

Аlena Ivannitskaya 11:44 2025-05-28 UTC+2

Update on US stock market on May 28

S&P500 US stock market is showing buoyant growth Snapshot of major US stock indices on Tuesday: Dow Jones: +1.8% NASDAQ: +2.5% S&P 500: +2.1% S&P 500 at 5,921

Jozef Kovach 10:38 2025-05-28 UTC+2

Stock Market on May 28th: S&P 500 and NASDAQ Continue Their Rapid Rally

Following the most recent regular session, U.S. stock indices closed with strong gains. The S&P 500 rose by 2.00%, while the Nasdaq 100 added 2.47%. The Dow Jones Industrial Average

Jakub Novak 09:43 2025-05-28 UTC+2

S&P 500 Forecast for May 28, 2025

The U.S. stock index, the S&P 500, has completed the correction that began on May 20. A sign of its completion is the price breakout above the inner boundary

Laurie Bailey 05:08 2025-05-28 UTC+2

Domestic Demand and Attractive Prices

The wave structure on the 24-hour chart for the #SPX instrument is generally easy to interpret. The global five-wave pattern doesn't even fit within the terminal window at the smallest

Chin Zhao 11:56 2025-05-27 UTC+2

Stock Market Update for May 27th: S&P 500 and NASDAQ Still Have Growth Potential

Following the most recent regular session, U.S. stock indices closed lower. The S&P 500 fell by 0.67%, while the Nasdaq 100 lost 1.00%. The industrial Dow Jones dropped by 0.61%

Jakub Novak 11:08 2025-05-27 UTC+2

Update on US stock market on May 27. Market picking up steam

S&P500 Snapshot of key US stock indices on Monday: Dow: -0%, NASDAQ: -0%, S&P 500: -0%, S&P 500 at 5802, with a trading range of 5400–6200. On Monday, US index

Jozef Kovach 10:40 2025-05-27 UTC+2
Can't speak right now?
Ask your question in the chat.
Widget callback
 

Dear visitor,

Your IP address shows that you are currently located in the USA. If you are a resident of the United States, you are prohibited from using the services of InstaFintech Group including online trading, online transfers, deposit/withdrawal of funds, etc.

If you think you are seeing this message by mistake and your location is not the US, kindly proceed to the website. Otherwise, you must leave the website in order to comply with government restrictions.

Why does your IP address show your location as the USA?

  • - you are using a VPN provided by a hosting company based in the United States;
  • - your IP does not have proper WHOIS records;
  • - an error occurred in the WHOIS geolocation database.

Please confirm whether you are a US resident or not by clicking the relevant button below. If you choose the wrong option, being a US resident, you will not be able to open an account with InstaForex anyway.

We are sorry for any inconvenience caused by this message.