signal strength 1 of 5

According to the chart of M5, EURUSD formed the Bearish Rectangle which is a pattern of a trend continuation. The pattern is contained within the following borders: lower border 1.0924 – 1.0924 and upper border 1.0967 – 1.0967. In case the lower border is broken, the instrument is likely to follow the downward trend.
The M5 and M15 time frames may have more false entry points.
See Also
- All
- Double Top
- Flag
- Head and Shoulders
- Pennant
- Rectangle
- Triangle
- Triple top
- All
- #AAPL
- #AMZN
- #Bitcoin
- #EBAY
- #FB
- #GOOG
- #INTC
- #KO
- #MA
- #MCD
- #MSFT
- #NTDOY
- #PEP
- #TSLA
- #TWTR
- AUDCAD
- AUDCHF
- AUDJPY
- AUDUSD
- EURCAD
- EURCHF
- EURGBP
- EURJPY
- EURNZD
- EURRUB
- EURUSD
- GBPAUD
- GBPCHF
- GBPJPY
- GBPUSD
- GOLD
- NZDCAD
- NZDCHF
- NZDJPY
- NZDUSD
- SILVER
- USDCAD
- USDCHF
- USDJPY
- USDRUB
- All
- M5
- M15
- M30
- H1
- D1
- All
- Buy
- Sale
- All
- 1
- 2
- 3
- 4
- 5
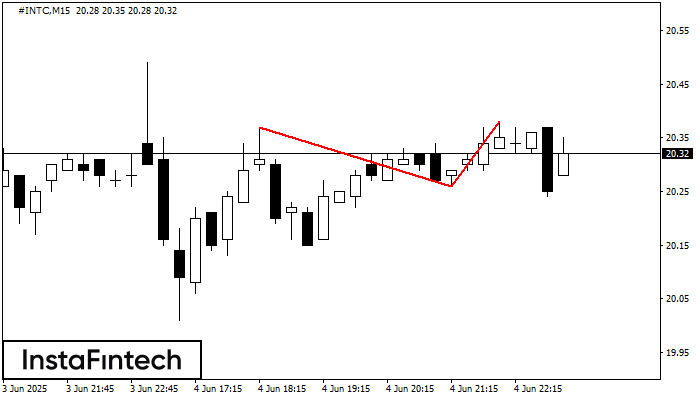
The Double Top pattern has been formed on #INTC M15. It signals that the trend has been changed from upwards to downwards. Probably, if the base of the pattern 20.26
The M5 and M15 time frames may have more false entry points.
Open chart in a new window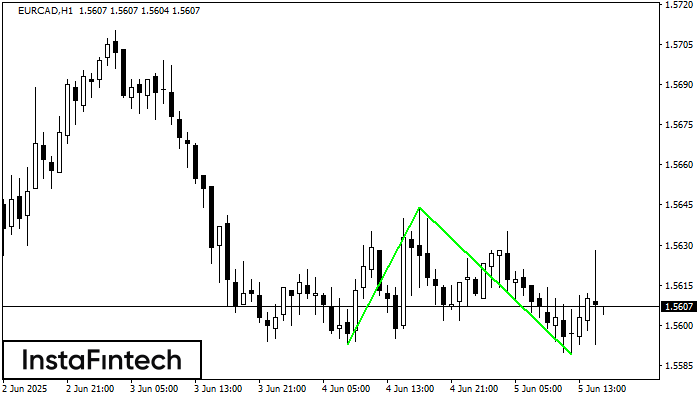
The Double Bottom pattern has been formed on EURCAD H1; the upper boundary is 1.5644; the lower boundary is 1.5589. The width of the pattern is 51 points. In case
Open chart in a new window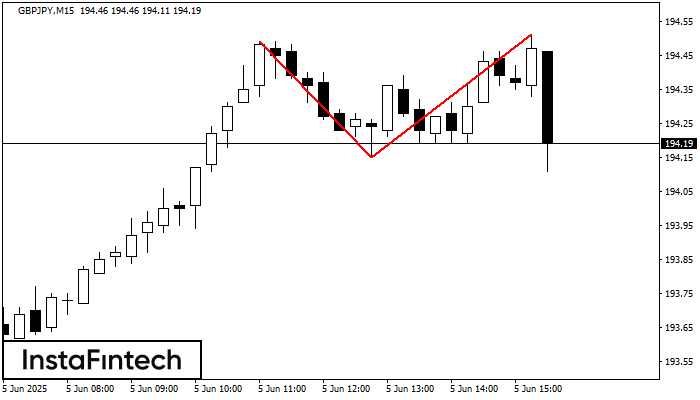
The Double Top reversal pattern has been formed on GBPJPY M15. Characteristics: the upper boundary 194.49; the lower boundary 194.15; the width of the pattern is 36 points. Sell trades
The M5 and M15 time frames may have more false entry points.
Open chart in a new window