GBP/USD 5-Minute Analysis
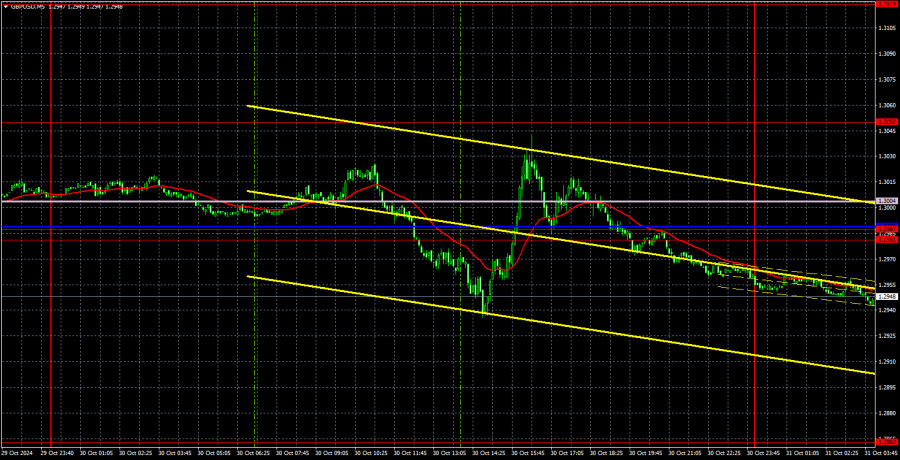
The GBP/USD currency pair showed mixed movements on Wednesday, with an apparent reluctance to rise. Unlike EUR/USD, the GBP/USD pair had a much sparser macroeconomic background. While the euro received support from German inflation and Eurozone GDP reports, the British currency lacked such backing. Traders responded to the U.S. ADP and GDP reports, which contradicted each other since one was stronger than expected while the other was weaker—as a result, the day ended near multi-month lows for the British pound.
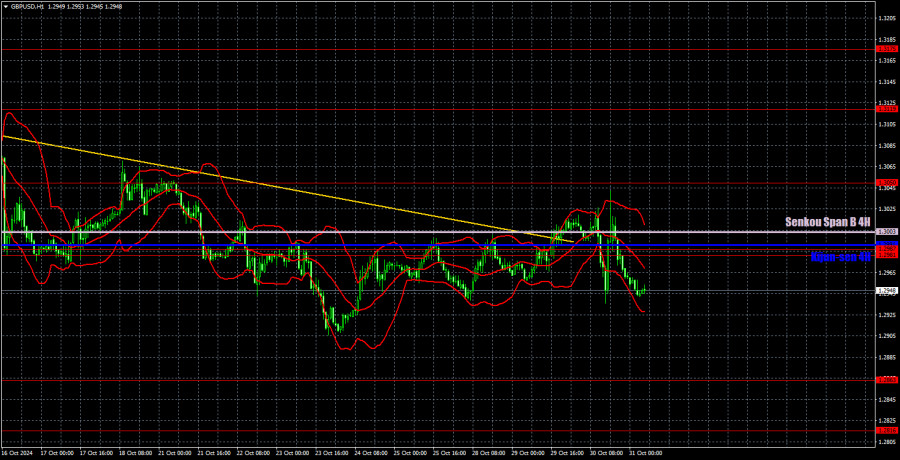
The trend line was breached, yet no upward correction has emerged. The price remains below the Ichimoku indicator lines, with no macroeconomic or fundamental support for the pound. Despite the pair's month-long decline, a correction still seems unlikely. With two more days left this week and some important U.S. reports upcoming, the dollar could quickly strengthen further. So, while a correction is possible, it will depend on Thursday and Friday's U.S. data releases.
On the 5-minute chart, the price couldn't establish a clear direction yesterday. Traders could have opened positions around the 1.2981-1.3004 area, but as seen, the macroeconomic background affected the pair's movements unfavorably. A similar pattern could occur today and tomorrow.
COT Report Analysis
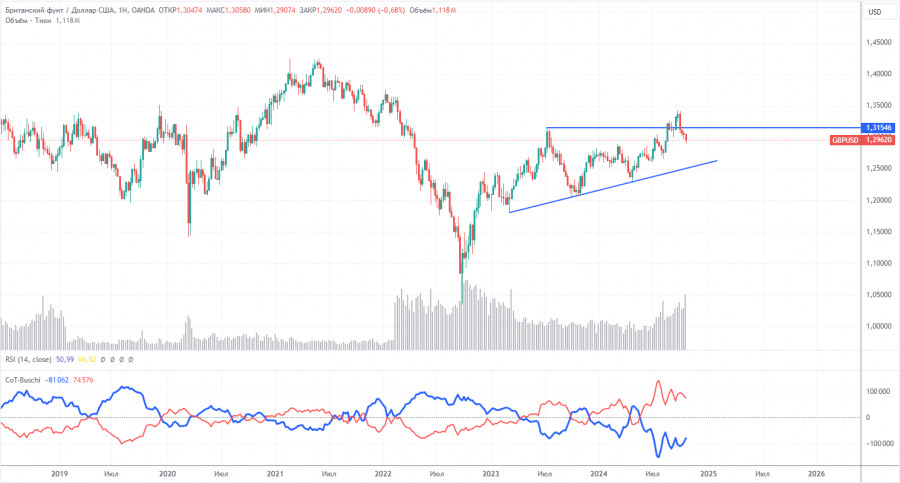
The COT (Commitment of Traders) reports on the British pound show that commercial traders' sentiment has constantly shifted over recent years. The red and blue lines, representing the net positions of commercial and non-commercial traders, frequently cross and are mostly close to the zero mark. We also observe that the latest downtrend cycle coincided with a period when the red line was below the zero mark. Currently, the red line is above zero, and the price has broken an important level at 1.3154.
According to the latest COT report on the British pound, the non-commercial group closed 11,300 BUY contracts and only 100 SELL contracts. Consequently, the net position of non-commercial traders decreased by 11,300 contracts. In the medium term, the market still shows little interest in selling the pound sterling.
The fundamental backdrop still provides no basis for long-term purchases of the pound sterling, and the currency has a real chance of resuming a global downtrend. However, on the weekly time frame, an ascending trendline is in place, so until this is broken, it is premature to expect a long-term decline in the pound. The pound sterling has continued to rise despite nearly every adverse condition (again, in the medium term), and even when COT reports indicate that major players are selling the pound, it still manages to climb.
GBP/USD 1-Hour Analysis
On the hourly chart, GBP/USD continues its downward movement. The upward trend has been canceled, suggesting further declines for the British currency, potentially steep and prolonged. For the pound's decline to continue, traders must keep the price below the 1.2981-1.2987 area. Although there are grounds for a correction, it may only occur if the U.S. data disappoints.
For October 31, we highlight the following key levels: 1.2796-1.2816, 1.2863, 1.2981-1.2987, 1.3050, 1.3119, 1.3175, 1.3222, 1.3273, 1.3367, and 1.3439. The Senkou Span B (1.3003) and Kijun-sen (1.2992) lines could also provide signals. It is recommended to set a Stop Loss to break even if the price moves 20 pips in the favorable direction. The Ichimoku indicator lines may shift throughout the day, so consider this when identifying trading signals.
On Thursday, no significant events are scheduled in the UK, but the U.S. will release at least one report that could interest traders – the core personal consumption expenditures (PCE) price index. Aside from some minor data, this report is today's only notable event. Hence, it's unlikely that the pound will find solid grounds for strengthening today.
Chart Explanations:
Support and resistance levels: thick red lines around which movement may end. They are not sources of trading signals.
Kijun-sen and Senkou Span B lines: Ichimoku indicator lines transferred from the 4-hour to the 1-hour timeframe. These are strong lines.
Extreme levels: thin red lines where the price previously rebounded. They are sources of trading signals.
Yellow lines: Trend lines, trend channels, and other technical patterns.
Indicator 1 on COT charts: The net position size for each category of traders.


