empty
11.04.2025 05:03 AM
EUR/USD Forecast for April 11, 2025

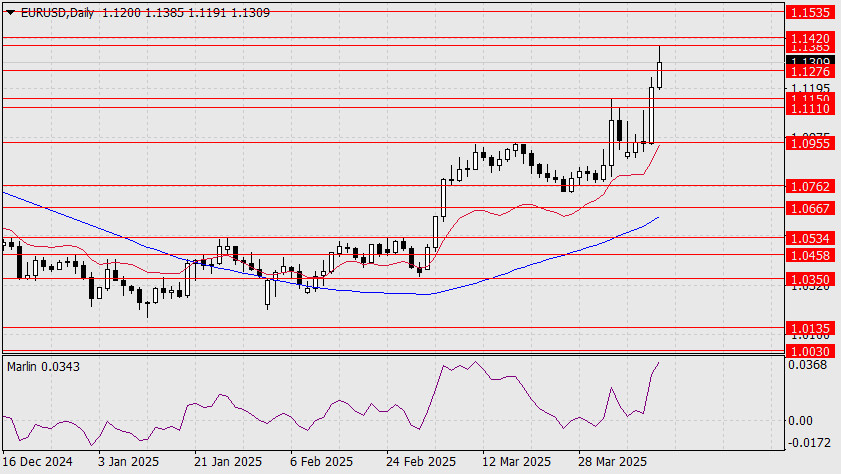
Over the past day and this morning, the euro has reached the target range of 1.1385–1.1420, corresponding to the highs of June 2019 and 2020. The signal line of the Marlin oscillator has slowed its climb in the overbought zone, reaching the peak last seen on March 11.

There are no other indications of trend exhaustion or reversal, so price action will likely continue to follow the upcoming target levels.

  • If the price falls back below 1.1276, expect a move toward the 1.1110/50 range.
  • A drop below that range opens the path toward 1.0955.

This image is no longer relevant

Should the price find the strength to break above the 1.1385–1.1420 range, the next target becomes 1.1535.

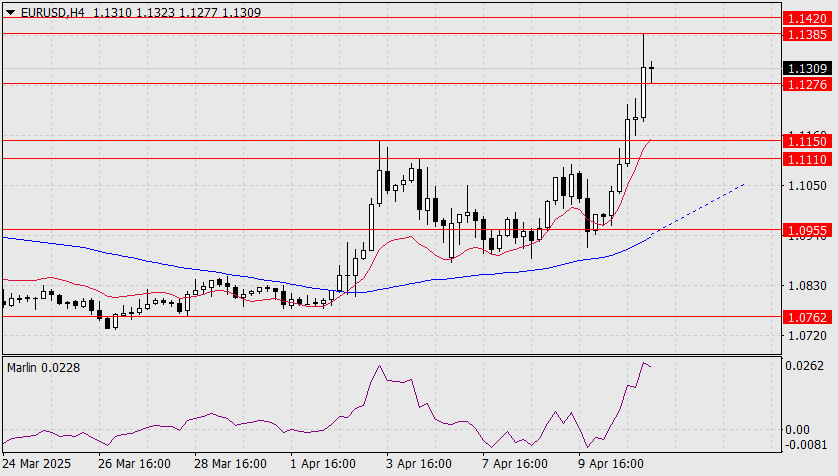
The H4 chart's technical picture is similar: the Marlin oscillator has reached a local high (this time from April 3), and the price is currently hovering around the 1.1276 support.

This image is no longer relevant

A confirmed break below 1.1276 opens the way to the target zone 1.1110/50.

The MACD line is approaching this support zone—if the price slows its descent and reaches the support area, this line could reinforce the range. A breakout below both the range and the indicator line would signal a medium-term trend reversal to the downside.

Laurie Bailey,
InstaForex के विश्लेषणात्मक विशेषज्ञ
© 2007-2025
Summary
Urgency
Analytic
Yuriy Zaycev
Start trade
Earn on cryptocurrency rate changes with InstaForex
Download MetaTrader 4 and open your first trade
  • चैन्सी डिपॉजिट
    $ 3,000 के साथ अपना खाता जमा करें और प्राप्त करें $3000 अधिक!
    में सितंबर हम आकर्षित करते हैं $3000 चैंसी डिपॉज़िट में
    ट्रेडिंग अकाउंट में $ 3,000 जमा करके जीतने का अवसर प्राप्त करें इस शर्त को पूरा करके आप प्रतियोगिता में भाग ले सकते हैं
    कॉन्टेस्ट में हिस्सा लें

अनुशंसित लेख

18-23 सितंबर, 2025 के लिए BITCOIN (BTC/USD) के ट्रेडिंग सिग्नल: $116,000 के ऊपर खरीदें (6/8 मरे - 21 SMA)

बिटकॉइन H4 चार्ट पर बने अपट्रेंड चैनल के भीतर ट्रेड कर रहा है। कल, अपट्रेंड चैनल के निचले स्तर लगभग $114,800 तक पहुँचने के बाद, इसने अपना बुलिश चक्र फिर

Dimitrios Zappas 12:19 2025-09-18 UTC+2

आज XPD/USD कमजोर होने की संभावना है, क्योंकि एक छिपा हुआ बुलिश डाइवर्जेंस (Hidden Bearish Divergence) दिखाई दे रहा है। गुरुवार, 18 सितंबर, 2025।

[XPD/USD] – [गुरुवार, 18 सितंबर, 2025] एक छिपा हुआ मंदी संकेतक (Hidden Bearish Divergence) दिखाई देने के साथ, और दो EMAs का डेथ क्रॉस (Death Cross) बनना यह संकेत देता

Arief Makmur 12:00 2025-09-18 UTC+2

नास्डैक 100 इंडेक्स आज मजबूत होने की संभावना रखता है और अपने सबसे नजदीकी रेसिस्टेंस स्तर तक पहुँच सकता है। गुरुवार, 18 सितंबर, 2025।

[नास्डैक 100 इंडेक्स] – [गुरुवार, 18 सितंबर, 2025] नास्डैक 100 इंडेक्स आज मजबूत होने की क्षमता रखता है, जैसा कि इसके दो EMAs के गोल्डन क्रॉस में मिलने

Arief Makmur 11:58 2025-09-18 UTC+2

17 सितंबर, 2025 को EUR/USD का पूर्वानुमान

मंगलवार को, EUR/USD जोड़ी 1.1789–1.1802 के प्रतिरोध क्षेत्र से ऊपर समेकित हुई और 1.1896 पर 127.2% फिबोनाची रिट्रेसमेंट स्तर की ओर अपनी ऊपर की ओर गति जारी रखी।

Samir Klishi 20:18 2025-09-17 UTC+2

हालाँकि आज AUD/JPY में ऊपर की ओर बढ़ने की क्षमता है, लेकिन इसमें नीचे की ओर सुधार की भी संभावना है। बुधवार, 17 सितंबर, 2025।

[AUD/JPY] – बुधवार, 17 सितंबर, 2025 RSI और AUD/JPY मूल्य चाल के बीच एक छिपे हुए मंदी के विचलन का दिखना निकट भविष्य में कमज़ोरी की संभावना को दर्शाता है।

Arief Makmur 20:17 2025-09-17 UTC+2

16 सितंबर, 2025 को EUR/USD का पूर्वानुमान

EUR/USD यूरो, पूरे मुद्रा और संबंधित बाजारों के साथ, कल जोखिम की ओर बढ़ा। कीमत ने MACD इंडिकेटर लाइन के ऊपर पूरी तरह से स्थिरीकरण किया, जिससे प्राइस चैनल की

Laurie Bailey 06:22 2025-09-16 UTC+2

16 सितंबर, 2025 को GBP/USD का पूर्वानुमान

GBP/USD स्टर्लिंग कल डॉलर इंडेक्स में 0.37% की गिरावट के बीच 40 पिप्स बढ़ा। हालांकि, यह वृद्धि औसत से कम वॉल्यूम पर हुई, जो केवल इस बात को रेखांकित करती

Laurie Bailey 06:20 2025-09-16 UTC+2

16 सितंबर, 2025 को EUR/NZD का पूर्वानुमान

EUR/NZD EUR/NZD जोड़ी ने अपने डाउनवर्ड परिदृश्य को छोड़ दिया और MACD लाइन पर समर्थन से उलटते हुए ऊपर की ओर बढ़ी। 1.9778 के ऊपर एक स्थिरीकरण, मार्लिन ऑस्सीलेटर के

Laurie Bailey 06:16 2025-09-16 UTC+2

15-18 सितंबर, 2025 के लिए सोने (XAU/USD) के लिए ट्रेडिंग सिग्नल: $3,671 से नीचे बेचें (7/8 मरे - 21 SMA)

3,644 से नीचे की कीमत में गिरावट ट्रेंड रिवर्सल की शुरुआत का संकेत हो सकती है। इस प्रकार, कीमत 200 EMA के आसपास $3,600 तक पहुँच सकती है, या 6/8

Dimitrios Zappas 20:04 2025-09-15 UTC+2

EUR/NZD का पूर्वानुमान – 12 सितंबर, 2025

कल, EUR/NZD जोड़ी ने दैनिक स्तर के MACD लाइन को बैलेंस लाइन के साथ इसके क्रॉसिंग पर नीचे तोड़ दिया। यह लगातार गिरावट के लिए एक मजबूत संकेत है। मार्लिन

Laurie Bailey 06:22 2025-09-12 UTC+2
अभी बात नहीं कर सकते?
अपना प्रश्न पूछें बातचीत.
Widget callback
 

Dear visitor,

Your IP address shows that you are currently located in the USA. If you are a resident of the United States, you are prohibited from using the services of InstaFintech Group including online trading, online transfers, deposit/withdrawal of funds, etc.

If you think you are seeing this message by mistake and your location is not the US, kindly proceed to the website. Otherwise, you must leave the website in order to comply with government restrictions.

Why does your IP address show your location as the USA?

  • - you are using a VPN provided by a hosting company based in the United States;
  • - your IP does not have proper WHOIS records;
  • - an error occurred in the WHOIS geolocation database.

Please confirm whether you are a US resident or not by clicking the relevant button below. If you choose the wrong option, being a US resident, you will not be able to open an account with InstaForex anyway.

We are sorry for any inconvenience caused by this message.