empty
23.01.2025 01:01 PM
Stock Market: S&P 500 and NASDAQ Pull Back from Yearly Highs

After reaching new yearly highs, U.S. stock indices have pulled back slightly. Futures on the S&P 500 lost about 0.1% and continue to trade in the red, while the tech-heavy NASDAQ is down 0.2%. The Dow Jones Industrial Average remains flat. Meanwhile, futures on the Euro Stoxx 50 dropped by 0.2%, while the MSCI Asia Pacific Index rose for the fourth consecutive session, marking its longest winning streak in nearly a month. Gains were driven by mainland Chinese stocks, with the CSI 300 Index rising as much as 1.8%.

This image is no longer relevant

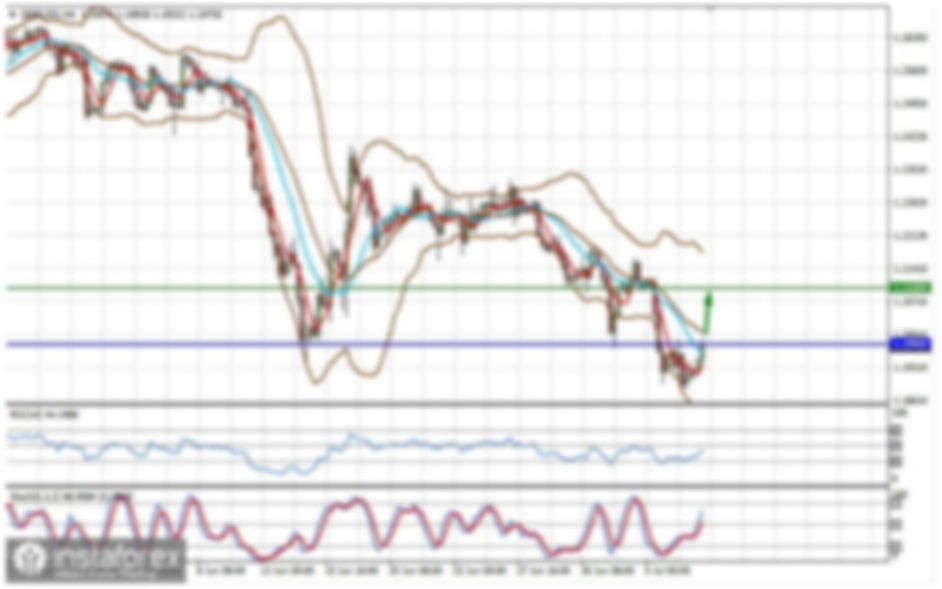
Demand for the S&P 500 has softened slightly, but the decline remains within the bounds of a correction. The main target for buyers today will be to defend the $6069 level. This would help maintain the uptrend and pave the way for a move toward $6079.

Another key priority for bulls is to secure control above $6092, which would further strengthen their position. In the event of a pullback due to waning risk appetite, buyers must defend $6069. A break below this level would likely push the index back to $6058, opening the door to further declines toward $6047.

MobileTrader

MobileTrader: trading platform near at hand!

Download and start right now!

Jakub Novak,
Analytical expert of InstaForex
© 2007-2025
Select timeframe
5
min
15
min
30
min
1
hour
4
hours
1
day
1
week
Earn on cryptocurrency rate changes with InstaForex
Download MetaTrader 4 and open your first trade
  • Grand Choice
    Contest by
    InstaForex
    InstaForex always strives to help you
    fulfill your biggest dreams.
    JOIN CONTEST

Recommended Stories

Stock market recap for May 2: S&P 500 and Nasdaq under renewed pressure

US equity indices closed mixed in the latest regular trading session. The S&P 500 slipped 0.01%, while the Nasdaq 100 dropped 0.32%. The industrial Dow Jones eked out a gain

Jakub Novak 12:41 2025-06-02 UTC+2

Update on US stock market on June 2. Market consolidating just below highs

S&P500 Snapshot of major US stock indices on Friday: Dow +0.1%, NASDAQ -0.3%, S&P 500 flat (0%), closing at 5911, within the 5400–6200 range. Catalysts of the trading session

Jozef Kovach 12:39 2025-06-02 UTC+2

Stock Market on May 30th: S&P 500 and NASDAQ Resume Decline

At the close of the latest regular session, U.S. stock indices posted modest gains. The S&P 500 rose by 0.40%, the Nasdaq 100 added 0.39%, and the Dow Jones Industrial

Jakub Novak 10:45 2025-05-30 UTC+2

US Market: Court overturns trump tariffs

S&P 500 Market overview on 29.05 A federal court in the US has struck down all of former President Trump's trade tariffs. Major US indices on Wednesday: Dow -0.6%, NASDAQ

Jozef Kovach 12:53 2025-05-29 UTC+2

Stock Market on May 29th: S&P 500 and Nasdaq Pause Their Rally

At the close of the most recent regular trading session, U.S. stock indices posted modest losses. The S&P 500 declined by 0.56%, the Nasdaq 100 fell by 0.71%

Jakub Novak 11:04 2025-05-29 UTC+2

Navigating dollar surge and tech turmoil: key entry points for traders

Volatility has returned to financial markets. The dollar staged a sharp rally, driving down the yen, euro, and Swiss franc, but beneath the surface lies a web of unsettling signals

Аlena Ivannitskaya 11:44 2025-05-28 UTC+2

Update on US stock market on May 28

S&P500 US stock market is showing buoyant growth Snapshot of major US stock indices on Tuesday: Dow Jones: +1.8% NASDAQ: +2.5% S&P 500: +2.1% S&P 500 at 5,921

Jozef Kovach 10:38 2025-05-28 UTC+2

Stock Market on May 28th: S&P 500 and NASDAQ Continue Their Rapid Rally

Following the most recent regular session, U.S. stock indices closed with strong gains. The S&P 500 rose by 2.00%, while the Nasdaq 100 added 2.47%. The Dow Jones Industrial Average

Jakub Novak 09:43 2025-05-28 UTC+2

S&P 500 Forecast for May 28, 2025

The U.S. stock index, the S&P 500, has completed the correction that began on May 20. A sign of its completion is the price breakout above the inner boundary

Laurie Bailey 05:08 2025-05-28 UTC+2

Domestic Demand and Attractive Prices

The wave structure on the 24-hour chart for the #SPX instrument is generally easy to interpret. The global five-wave pattern doesn't even fit within the terminal window at the smallest

Chin Zhao 11:56 2025-05-27 UTC+2
Can't speak right now?
Ask your question in the chat.
Widget callback
 

Dear visitor,

Your IP address shows that you are currently located in the USA. If you are a resident of the United States, you are prohibited from using the services of InstaFintech Group including online trading, online transfers, deposit/withdrawal of funds, etc.

If you think you are seeing this message by mistake and your location is not the US, kindly proceed to the website. Otherwise, you must leave the website in order to comply with government restrictions.

Why does your IP address show your location as the USA?

  • - you are using a VPN provided by a hosting company based in the United States;
  • - your IP does not have proper WHOIS records;
  • - an error occurred in the WHOIS geolocation database.

Please confirm whether you are a US resident or not by clicking the relevant button below. If you choose the wrong option, being a US resident, you will not be able to open an account with InstaForex anyway.

We are sorry for any inconvenience caused by this message.