signal strength 2 of 5

The Bearish Flag pattern has been formed on the chart AUDJPY M15 which signals that the downward trend will continue. If the price breaks below the low at 90.01, then it is most likely to move further downwards. The price will likely move by the number of points which equals the length of the flag pole (15 points).
The M5 and M15 time frames may have more false entry points.
- All
- Double Top
- Flag
- Head and Shoulders
- Pennant
- Rectangle
- Triangle
- Triple top
- All
- #AAPL
- #AMZN
- #Bitcoin
- #EBAY
- #FB
- #GOOG
- #INTC
- #KO
- #MA
- #MCD
- #MSFT
- #NTDOY
- #PEP
- #TSLA
- #TWTR
- AUDCAD
- AUDCHF
- AUDJPY
- AUDUSD
- EURCAD
- EURCHF
- EURGBP
- EURJPY
- EURNZD
- EURRUB
- EURUSD
- GBPAUD
- GBPCHF
- GBPJPY
- GBPUSD
- GOLD
- NZDCAD
- NZDCHF
- NZDJPY
- NZDUSD
- SILVER
- USDCAD
- USDCHF
- USDJPY
- USDRUB
- All
- M5
- M15
- M30
- H1
- D1
- All
- Buy
- Sale
- All
- 1
- 2
- 3
- 4
- 5
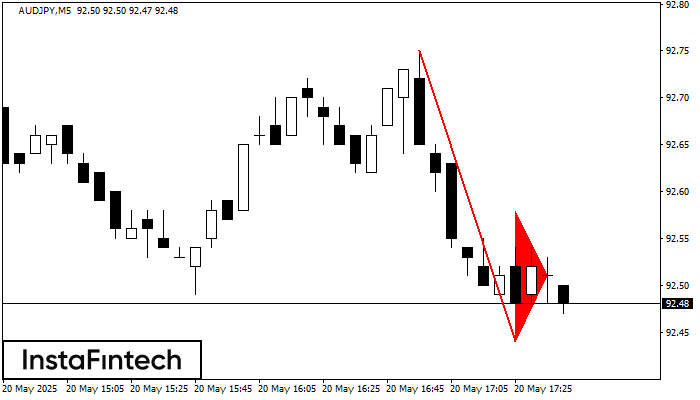
The Bearish pennant pattern has formed on the AUDJPY M5 chart. It signals potential continuation of the existing trend. Specifications: the pattern’s bottom has the coordinate of 92.44; the projection
The M5 and M15 time frames may have more false entry points.
Open chart in a new window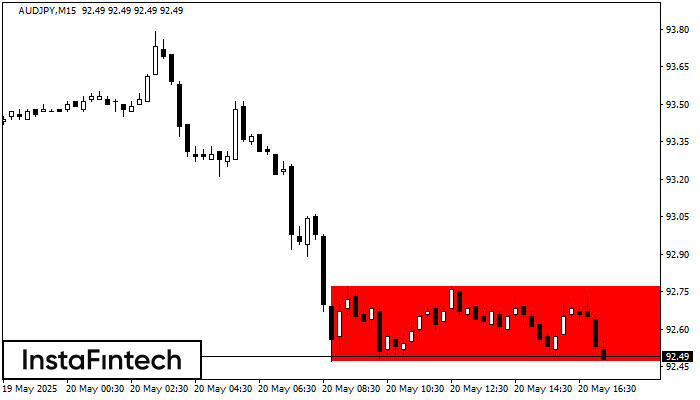
According to the chart of M15, AUDJPY formed the Bearish Rectangle which is a pattern of a trend continuation. The pattern is contained within the following borders: lower border 92.47
The M5 and M15 time frames may have more false entry points.
Open chart in a new window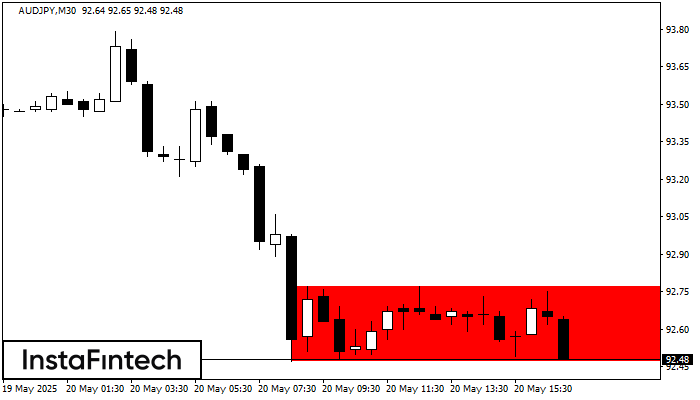
According to the chart of M30, AUDJPY formed the Bearish Rectangle which is a pattern of a trend continuation. The pattern is contained within the following borders: lower border 92.47
Open chart in a new window