signal strength 2 of 5

According to the chart of M15, USDCAD formed the Bullish Symmetrical Triangle pattern, which signals the trend will continue. Description. The upper border of the pattern touches the coordinates 1.3848/1.3836 whereas the lower border goes across 1.3821/1.3836. The pattern width is measured on the chart at 27 pips. If the Bullish Symmetrical Triangle pattern is in progress during the upward trend, this indicates the current trend will go on. In case 1.3836 is broken, the price could continue its move toward 1.3858.
The M5 and M15 time frames may have more false entry points.
See Also
- All
- Double Top
- Flag
- Head and Shoulders
- Pennant
- Rectangle
- Triangle
- Triple top
- All
- #AAPL
- #AMZN
- #Bitcoin
- #EBAY
- #FB
- #GOOG
- #INTC
- #KO
- #MA
- #MCD
- #MSFT
- #NTDOY
- #PEP
- #TSLA
- #TWTR
- AUDCAD
- AUDCHF
- AUDJPY
- AUDUSD
- EURCAD
- EURCHF
- EURGBP
- EURJPY
- EURNZD
- EURRUB
- EURUSD
- GBPAUD
- GBPCHF
- GBPJPY
- GBPUSD
- GOLD
- NZDCAD
- NZDCHF
- NZDJPY
- NZDUSD
- SILVER
- USDCAD
- USDCHF
- USDJPY
- USDRUB
- All
- M5
- M15
- M30
- H1
- D1
- All
- Buy
- Sale
- All
- 1
- 2
- 3
- 4
- 5
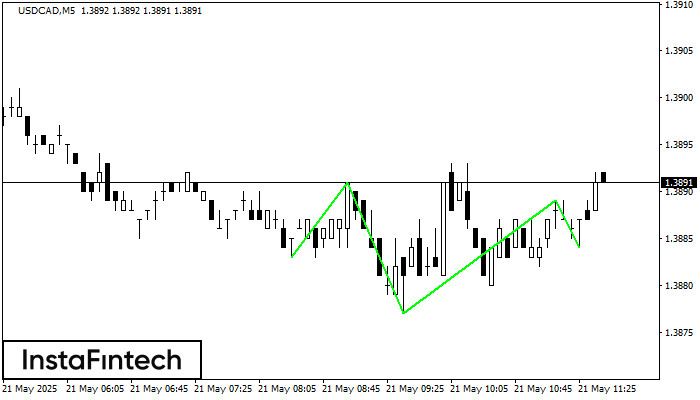
According to the chart of M5, USDCAD formed the Inverse Head and Shoulder pattern. The Head’s top is set at 1.3889 while the median line of the Neck is found
The M5 and M15 time frames may have more false entry points.
Open chart in a new window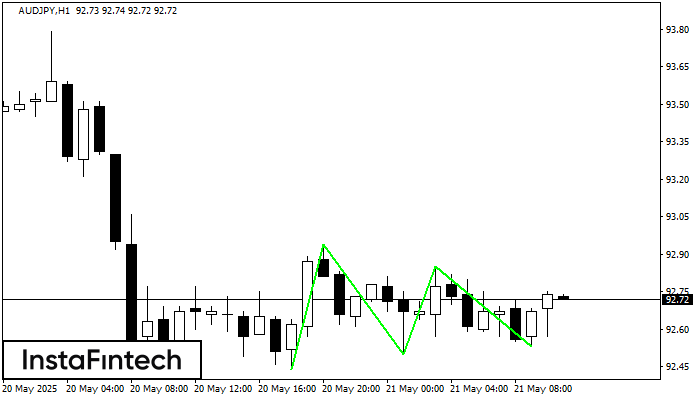
The Triple Bottom pattern has been formed on AUDJPY H1. It has the following characteristics: resistance level 92.94/92.85; support level 92.44/92.53; the width is 50 points. In the event
Open chart in a new window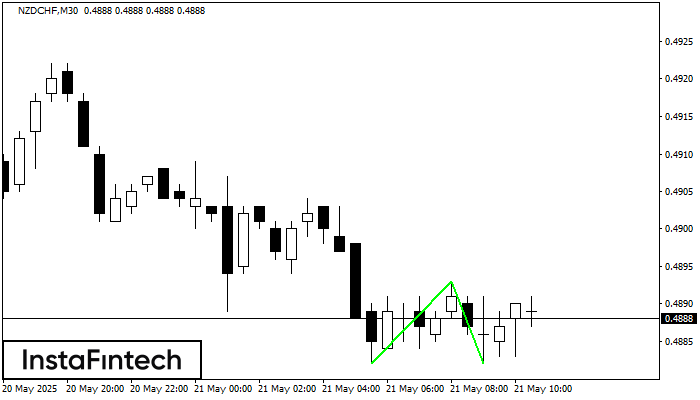
The Double Bottom pattern has been formed on NZDCHF M30. Characteristics: the support level 0.4882; the resistance level 0.4893; the width of the pattern 11 points. If the resistance level
Open chart in a new window