empty
24.03.2023 10:21 AM
EUR/USD and GBP/USD: trading plan for beginners on March 24, 2023

Macroeconomic calendar from March 23

At a monetary policy meeting yesterday, the Bank of England raised interest rates by 25 basis points to 4.25%, the highest rates since October 2008. Back then, interest rates were at 4.50%. The increase came due to persistent inflation. In February and January, consumer prices accelerated to 10.4% and 10.1% respectively. Meanwhile, economists had expected inflation to slow down in February. However, the latest press release hints at a possible end of the tightening cycle in the near term. So, it may be that we will soon see the regulator pause tightening.

Overview of technical charts from March 23

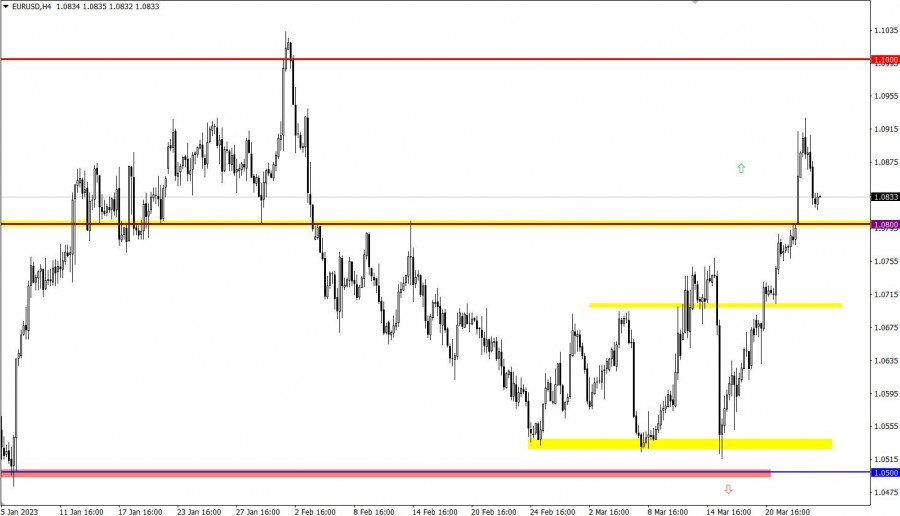
EUR/USD has gained over 250 pips since the beginning of the week. That triggered a horizontal movement with a signal to buy EUR. The volume of long positions decreased and the price retreated.

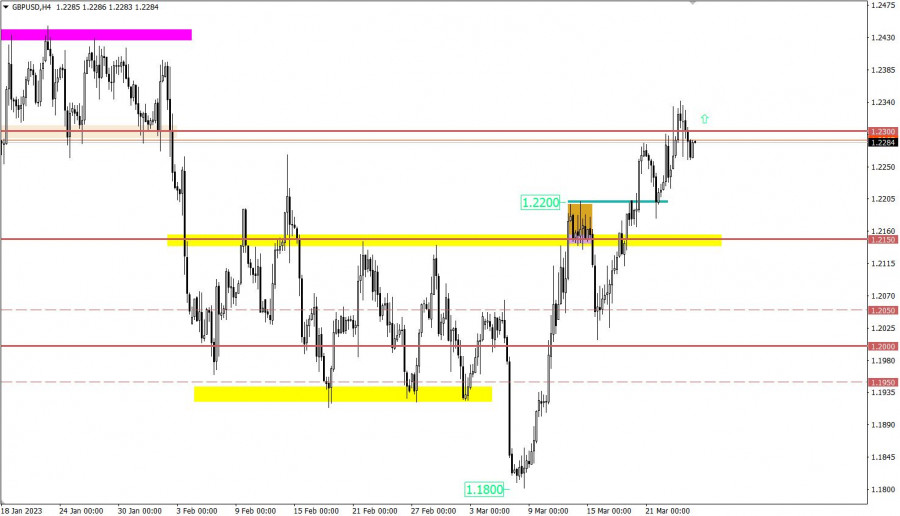
Once 1.2300 resistance was reached, GBP/USD pulled back somewhat. Nevertheless, the bull trend goes on. The pound has recouped almost all losses incurred in February.

This image is no longer relevant

Macroeconomic calendar on March 24

With the opening of European trade, UK retail sales came in, showing a rise to -3.5% versus -5.4% year-on-year. On a monthly basis, figures grew by 1.2%.

Today, a series of business activity reports will be delivered in the eurozone, the United States, and the United Kingdom. Economists expect figures to decline across the board.

Trading plan for EUR/USD on March 24

EUR/USD retreated to 1.0800 support. The price may rebound from this mark with a rise in buying volumes.

Alternatively, EUR/USD may go down if quotes stay below 1.0800 intraday.

This image is no longer relevant

Trading plan for GBP/USD on March 24

A pullback may cause a shift in sentiment. Should the price go above 1.2300, it would generate a signal to buy GBP. This could lead to a bullish continuation, and the pair could update the swing high of the medium-term trend.

Alternatively, if quotes fall below 1.2200, it will mark the rise of a downtrend.

This image is no longer relevant

What's on technical charts

The candlestick chart shows graphical white and black rectangles with upward and downward lines. While conducting a detailed analysis of each individual candlestick, it is possible to notice its features intrinsic to a particular time frame: the opening price, the closing price, and the highest and lowest price.

Horizontal levels are price levels, in relation to which a stop or reversal of the price may occur. They are called support and resistance levels.

Circles and rectangles are highlighted examples where the price reversed in the course of its history. This color highlighting indicates horizontal lines which can exert pressure on prices in the future.

Upward/downward arrows signal a possible future price direction.

Gven Podolsky,
انسٹافاریکس کا تجزیاتی ماہر
© 2007-2025
Summary
Urgency
Analytic
Vladislav Tukhmenev
Start trade
انسٹافاریکس کے ساتھ کرپٹو کرنسی کی معاملاتی تبدیلیوں سے کمائیں۔
میٹا ٹریڈر 4 ڈاؤن لوڈ کریں اور اپنی پہلی ٹریڈ کھولیں۔
  • چانسی ڈیپازٹ
    اپنے اکاؤنٹ میں 3000 ڈالر جمع کروائیں اور حاصل کریں$1000 مزید!
    ہم اگست قرعہ اندازی کرتے ہیں $1000چانسی ڈیپازٹ نامی مقابلہ کے تحت
    اپنے اکاؤنٹ میں 3000 ڈالر جمع کروانے پر موقع حاصل کریں - اس شرط پر پورا اُترتے ہوئے اس مقابلہ میں شرکت کریں
    مقابلہ میں شامل ہوں

تجویز کردہ مضامین

25 اگست کو برطانوی پاؤنڈ/امریکی ڈالر پیئر کی تجارت کیسے کی جائے؟ ابتدائی افراد کے لیے آسان تجاویز اور تجارتی تجزیہ

جمعہ کی تجارت کا تجزیہ برطانوی پاؤنڈ/امریکی ڈالر کا 1گھنٹے کا چارٹ جمعہ کو، برطانوی پاؤنڈ/امریکی ڈالر کے جوڑے نے بھی نیچے کی طرف حرکت کو ختم کر دیا،

Paolo Greco 14:17 2025-08-25 UTC+2

25 اگست کو یورو/امریکی ڈالر کے جوڑے کی تجارت کیسے کی جائے؟ نئے افراد کے لیے آسان تجاویز اور تجارتی تجزیہ

جمعہ کی تجارت کا تجزیہ یورو/امریکی ڈالر کا 1گھنٹے کا چارٹ جمعہ کو، یورو/امریکی ڈالر کرنسی کے جوڑے نے رجحان کو اوپر کی طرف موڑتے ہوئے ایک تیز "اضافہ" کیا۔

Paolo Greco 14:16 2025-08-25 UTC+2

25 اگست کو برطانوی پاؤنڈ/امریکی ڈالر کے لیے تجارتی سفارشات اور تجارتی خرابی۔ پاول نے ڈالر کو ہیلو کہا

برطانوی پاؤنڈ/امریکی ڈالر کا 5 منٹ کا تجزیہ برطانوی پاؤنڈ/امریکی ڈالر کے جوڑے نے تیزی سے نیچے کی طرف ہونے والی اصلاح کو ختم کیا اور ایک نیا اوپری رجحان

Paolo Greco 14:13 2025-08-25 UTC+2

25 اگست کو یورو/امریکی ڈالر کے لیے تجارتی سفارشات اور تجارتی بریک ڈاؤن۔ نیچے کی طرف درستگی ختم ہو گئی

جمعہ کے بیشتر حصے میں، یورو/امریکی ڈالر جوڑا آہستہ آہستہ نیچے کی طرف بڑھتا رہا، لیکن شام کے قریب، جیسے ہی جیروم پاول نے جیکسن ہول سمپوزیم میں اپنی تقریر

Paolo Greco 14:11 2025-08-25 UTC+2

Trading Recommendations and Trade Breakdown for GBP/USD on August 22: Correction Continues

On Thursday, the GBP/USD pair continued a weak downward move, which is corrective in nature. The British pound began to decline on August 14, a week ago. During this time

Paolo Greco 13:38 2025-08-22 UTC+2

22 اگست کو یورو/امریکی ڈالر کے لیے تجارتی سفارشات اور تجارتی بریک ڈاؤن۔ کوئی کمی کا رجحان نہیں!

یورو/امریکی ڈالر کا 5 منٹ کا تجزیہ یورو/امریکی ڈالر کے جوڑے نے جمعرات کا زیادہ تر وقت "نہ مچھلی اور نہ ہی مرغی" کے انداز میں گزارا۔ جی ہاں،

Paolo Greco 13:37 2025-08-22 UTC+2

21 اگست کو برطانوی پاؤنڈ/امریکی ڈالر پیئر کی تجارت کیسے کی جائے؟ نئے افراد کے لیے آسان تجاویز اور تجارتی تجزیہ

بدھ کی تجارت کا تجزیہ برطانوی پاؤنڈ/امریکی ڈالر کا 1گھنٹے کا چارٹ بدھ کو، برطانوی پاؤنڈ/امریکی ڈالر کے جوڑے نے نیچے کی طرف کمزور حرکت جاری رکھی، جو کہ خالصتاً

Paolo Greco 14:30 2025-08-21 UTC+2

21 اگست کو یورو/امریکی ڈالر کے جوڑے کی تجارت کیسے کی جائے؟ نئے افراد کے لیے آسان تجاویز اور تجارتی تجزیہ

بدھ کو، یورو/امریکی ڈالر کرنسی کا جوڑا کم سے کم اتار چڑھاؤ کے ساتھ اور واضح سمت کے بغیر آگے بڑھتا رہا۔ مزید واضح طور پر،

Paolo Greco 14:29 2025-08-21 UTC+2

21 اگست کو برطانوی پاؤنڈ/امریکی ڈالر کے لیے تجارتی سفارشات اور تجارتی خرابی: پاؤنڈ کی درستگی جاری ہے

برطانوی پاؤنڈ/امریکی ڈالر کا 5 منٹ کا تجزیہ بدھ کو،برطانوی پاؤنڈ/امریکی ڈالر جوڑے نے نیچے کی طرف کمزور حرکت جاری رکھی، جس کا ایک اصلاحی کردار ہے۔ قیمت بڑھتے ہوئے

Paolo Greco 14:25 2025-08-21 UTC+2

21 اگست کو یورو/امریکی ڈالر کے لیے تجارتی سفارشات اور تجارتی خرابی: فلیٹ جاری

یورو/امریکی ڈالر کا 5 منٹ کا تجزیہ بدھ کو یورو/امریکی ڈالر جوڑی نے پچھلے دنوں کی طرح اسی فلیٹ رینج میں تجارت جاری رکھی۔ اتار چڑھاؤ

Paolo Greco 14:23 2025-08-21 UTC+2
ابھی فوری بات نہیں کرسکتے ؟
اپنا سوال پوچھیں بذریعہ چیٹ.
Widget callback
 

Dear visitor,

Your IP address shows that you are currently located in the USA. If you are a resident of the United States, you are prohibited from using the services of InstaFintech Group including online trading, online transfers, deposit/withdrawal of funds, etc.

If you think you are seeing this message by mistake and your location is not the US, kindly proceed to the website. Otherwise, you must leave the website in order to comply with government restrictions.

Why does your IP address show your location as the USA?

  • - you are using a VPN provided by a hosting company based in the United States;
  • - your IP does not have proper WHOIS records;
  • - an error occurred in the WHOIS geolocation database.

Please confirm whether you are a US resident or not by clicking the relevant button below. If you choose the wrong option, being a US resident, you will not be able to open an account with InstaForex anyway.

We are sorry for any inconvenience caused by this message.