signal strength 2 of 5
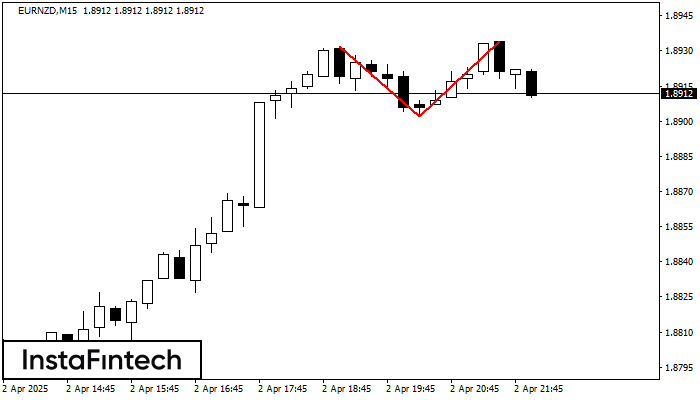
On the chart of EURNZD M15 the Double Top reversal pattern has been formed. Characteristics: the upper boundary 1.8934; the lower boundary 1.8902; the width of the pattern 32 points. The signal: a break of the lower boundary will cause continuation of the downward trend targeting the 1.8879 level.
The M5 and M15 time frames may have more false entry points.
- All
- Double Top
- Flag
- Head and Shoulders
- Pennant
- Rectangle
- Triangle
- Triple top
- All
- #AAPL
- #AMZN
- #Bitcoin
- #EBAY
- #FB
- #GOOG
- #INTC
- #KO
- #MA
- #MCD
- #MSFT
- #NTDOY
- #PEP
- #TSLA
- #TWTR
- AUDCAD
- AUDCHF
- AUDJPY
- AUDUSD
- EURCAD
- EURCHF
- EURGBP
- EURJPY
- EURNZD
- EURRUB
- EURUSD
- GBPAUD
- GBPCHF
- GBPJPY
- GBPUSD
- GOLD
- NZDCAD
- NZDCHF
- NZDJPY
- NZDUSD
- SILVER
- USDCAD
- USDCHF
- USDJPY
- USDRUB
- All
- M5
- M15
- M30
- H1
- D1
- All
- Buy
- Sale
- All
- 1
- 2
- 3
- 4
- 5
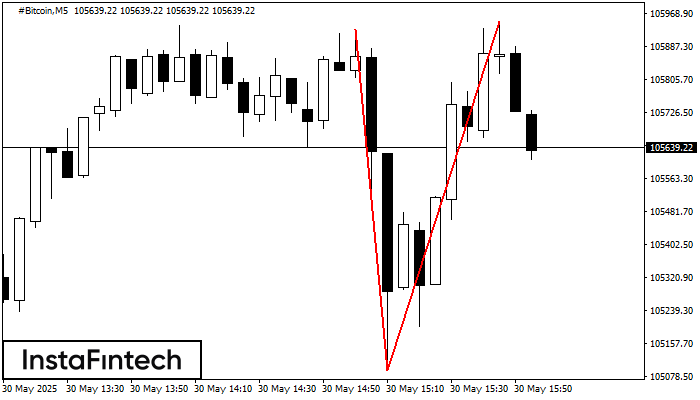
The Double Top pattern has been formed on #Bitcoin M5. It signals that the trend has been changed from upwards to downwards. Probably, if the base of the pattern 105092.75
The M5 and M15 time frames may have more false entry points.
Open chart in a new window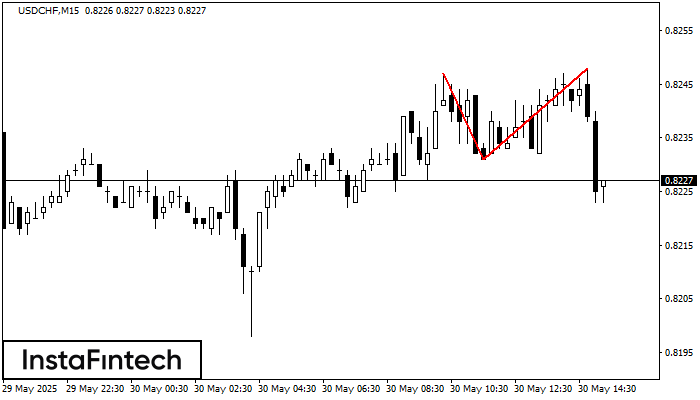
The Double Top reversal pattern has been formed on USDCHF M15. Characteristics: the upper boundary 0.8247; the lower boundary 0.8231; the width of the pattern is 17 points. Sell trades
The M5 and M15 time frames may have more false entry points.
Open chart in a new window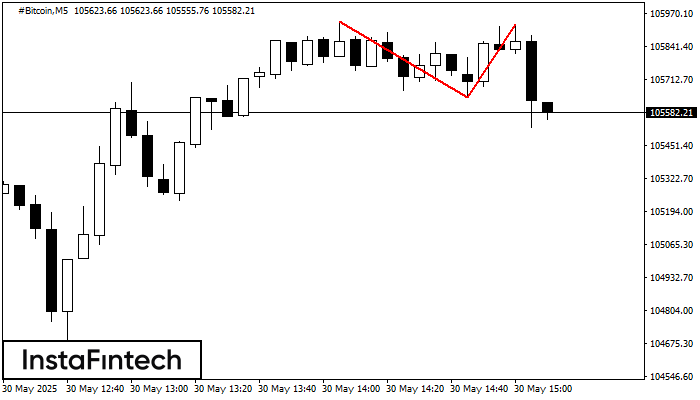
The Double Top pattern has been formed on #Bitcoin M5. It signals that the trend has been changed from upwards to downwards. Probably, if the base of the pattern 105641.82
The M5 and M15 time frames may have more false entry points.
Open chart in a new window