signal strength 1 of 5
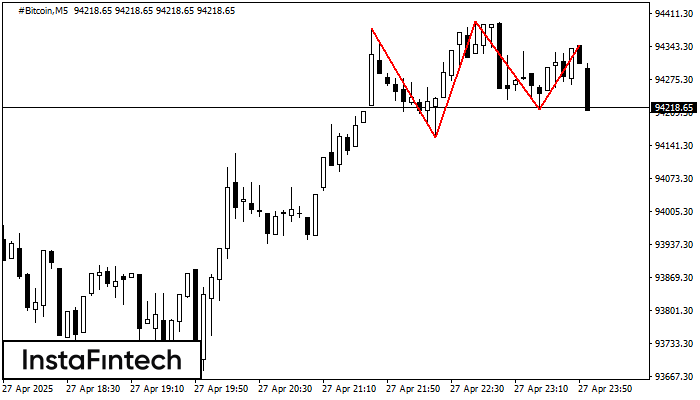
The Triple Top pattern has formed on the chart of the #Bitcoin M5 trading instrument. It is a reversal pattern featuring the following characteristics: resistance level 3568, support level -5728, and pattern’s width 22382. Forecast If the price breaks through the support level 94157.00, it is likely to move further down to 94395.22.
The M5 and M15 time frames may have more false entry points.
Veja também
- All
- Double Top
- Flag
- Head and Shoulders
- Pennant
- Rectangle
- Triangle
- Triple top
- All
- #AAPL
- #AMZN
- #Bitcoin
- #EBAY
- #FB
- #GOOG
- #INTC
- #KO
- #MA
- #MCD
- #MSFT
- #NTDOY
- #PEP
- #TSLA
- #TWTR
- AUDCAD
- AUDCHF
- AUDJPY
- AUDUSD
- EURCAD
- EURCHF
- EURGBP
- EURJPY
- EURNZD
- EURRUB
- EURUSD
- GBPAUD
- GBPCHF
- GBPJPY
- GBPUSD
- GOLD
- NZDCAD
- NZDCHF
- NZDJPY
- NZDUSD
- SILVER
- USDCAD
- USDCHF
- USDJPY
- USDRUB
- All
- M5
- M15
- M30
- H1
- D1
- All
- Buy
- Sale
- All
- 1
- 2
- 3
- 4
- 5

O padrão Topo triplo foi formado no gráfico do instrumento de negociação GOLD M5. É um padrão de reversão com as seguintes características: nível de resistência 4, nível de suporte
Os intervalos M5 e M15 podem ter mais pontos de entrada falsos.
Open chart in a new window
De acordo com o gráfico de M5, #AMZN produziu o padrão denominado Cabeça & Ombro Invertidos. A Cabeça é definida em 201.64 enquanto a linha mediana do Pescoço é definida
Os intervalos M5 e M15 podem ter mais pontos de entrada falsos.
Open chart in a new window
De acordo com o gráfico de M5, GBPAUD formou Retângulo de baixa que é um padrão de uma continuação de tendência. O padrão está dentro dos seguintes limites: limite inferior
Os intervalos M5 e M15 podem ter mais pontos de entrada falsos.
Open chart in a new window