signal strength 1 of 5
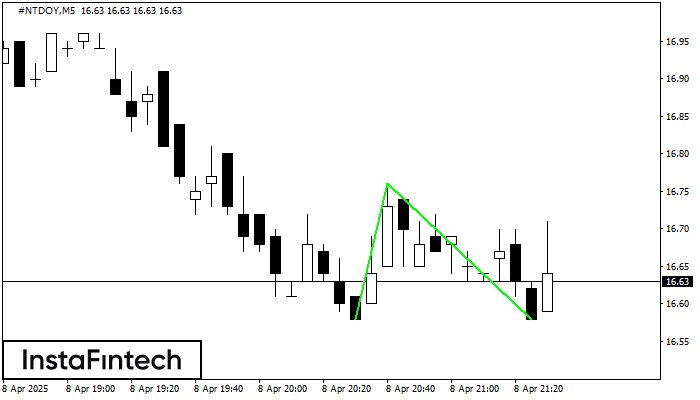
The Double Bottom pattern has been formed on #NTDOY M5. Characteristics: the support level 16.58; the resistance level 16.76; the width of the pattern 18 points. If the resistance level is broken, a change in the trend can be predicted with the first target point lying at the distance of 18 points.
The M5 and M15 time frames may have more false entry points.
See Also
- All
- Double Top
- Flag
- Head and Shoulders
- Pennant
- Rectangle
- Triangle
- Triple top
- All
- #AAPL
- #AMZN
- #Bitcoin
- #EBAY
- #FB
- #GOOG
- #INTC
- #KO
- #MA
- #MCD
- #MSFT
- #NTDOY
- #PEP
- #TSLA
- #TWTR
- AUDCAD
- AUDCHF
- AUDJPY
- AUDUSD
- EURCAD
- EURCHF
- EURGBP
- EURJPY
- EURNZD
- EURRUB
- EURUSD
- GBPAUD
- GBPCHF
- GBPJPY
- GBPUSD
- GOLD
- NZDCAD
- NZDCHF
- NZDJPY
- NZDUSD
- SILVER
- USDCAD
- USDCHF
- USDJPY
- USDRUB
- All
- M5
- M15
- M30
- H1
- D1
- All
- Buy
- Sale
- All
- 1
- 2
- 3
- 4
- 5
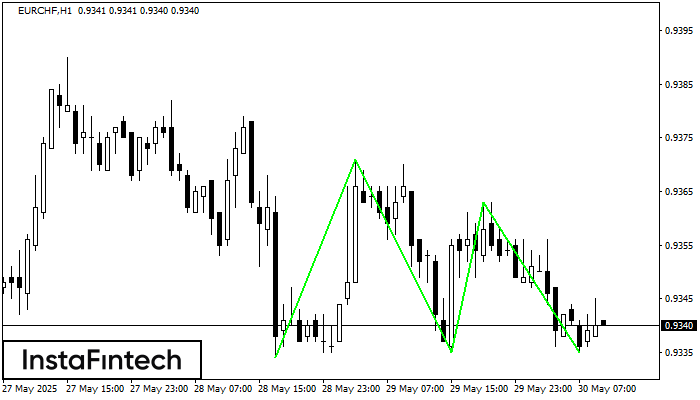
The Triple Bottom pattern has formed on the chart of EURCHF H1. Features of the pattern: The lower line of the pattern has coordinates 0.9371 with the upper limit 0.9371/0.9363
Open chart in a new window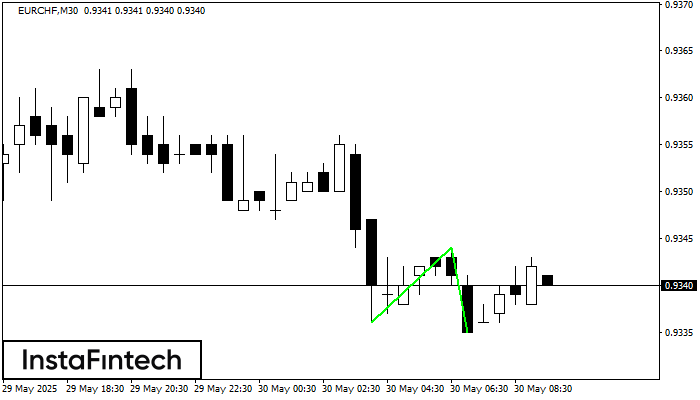
The Double Bottom pattern has been formed on EURCHF M30. This formation signals a reversal of the trend from downwards to upwards. The signal is that a buy trade should
Open chart in a new window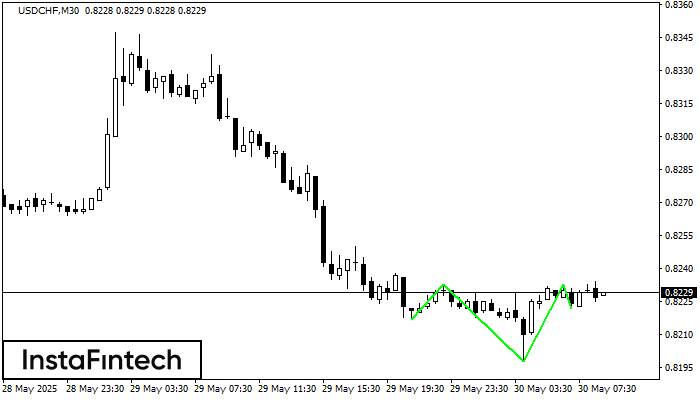
According to M30, USDCHF is shaping the technical pattern – the Inverse Head and Shoulder. In case the Neckline 0.8233/0.8233 is broken out, the instrument is likely to move toward
Open chart in a new window