signal strength 1 of 5
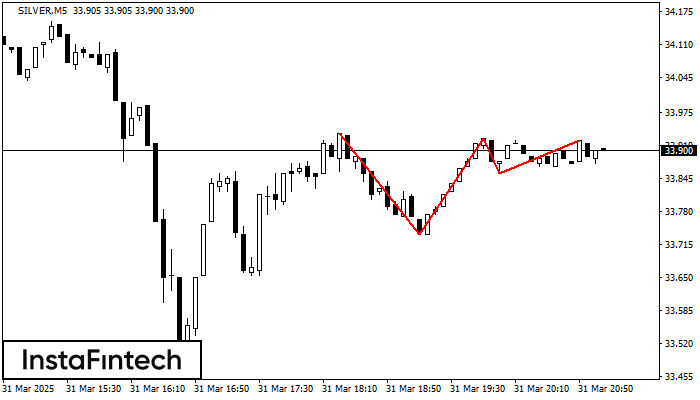
The Triple Top pattern has formed on the chart of the SILVER M5 trading instrument. It is a reversal pattern featuring the following characteristics: resistance level 15, support level -120, and pattern’s width 200. Forecast If the price breaks through the support level 33.73, it is likely to move further down to 33.91.
The M5 and M15 time frames may have more false entry points.
- All
- Double Top
- Flag
- Head and Shoulders
- Pennant
- Rectangle
- Triangle
- Triple top
- All
- #AAPL
- #AMZN
- #Bitcoin
- #EBAY
- #FB
- #GOOG
- #INTC
- #KO
- #MA
- #MCD
- #MSFT
- #NTDOY
- #PEP
- #TSLA
- #TWTR
- AUDCAD
- AUDCHF
- AUDJPY
- AUDUSD
- EURCAD
- EURCHF
- EURGBP
- EURJPY
- EURNZD
- EURRUB
- EURUSD
- GBPAUD
- GBPCHF
- GBPJPY
- GBPUSD
- GOLD
- NZDCAD
- NZDCHF
- NZDJPY
- NZDUSD
- SILVER
- USDCAD
- USDCHF
- USDJPY
- USDRUB
- All
- M5
- M15
- M30
- H1
- D1
- All
- Buy
- Sale
- All
- 1
- 2
- 3
- 4
- 5
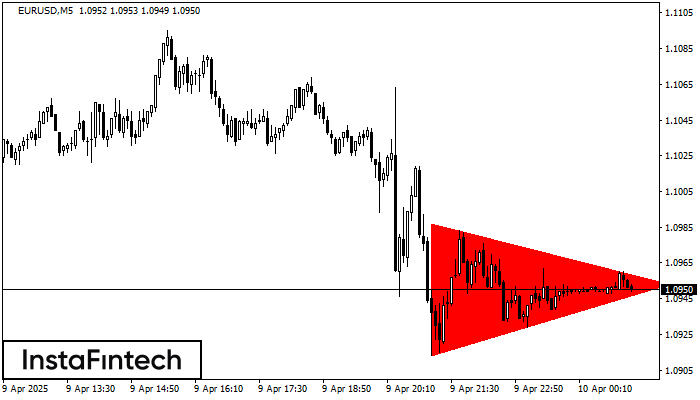
Según el gráfico de M5, el EURUSD formó el patrón Triángulo Simétrico Bajista. Descripción: El límite inferior es 1.0913/1.0953 y el límite superior es 1.0987/1.0953. El ancho del patrón
Los marcos de tiempo M5 y M15 pueden tener más puntos de entrada falsos.
Open chart in a new window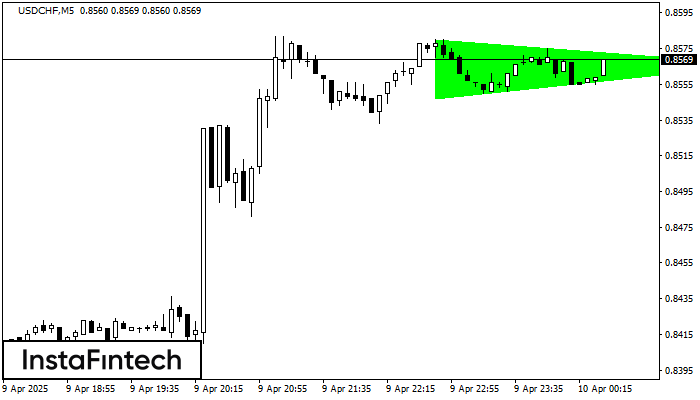
Según el gráfico de M5, USDCHF formó el patrón Triángulo Simétrico Alcista. Descripción: Este es el patrón de la continuación de una tendencia. 0.8580 y 0.8547 son las coordenadas
Los marcos de tiempo M5 y M15 pueden tener más puntos de entrada falsos.
Open chart in a new window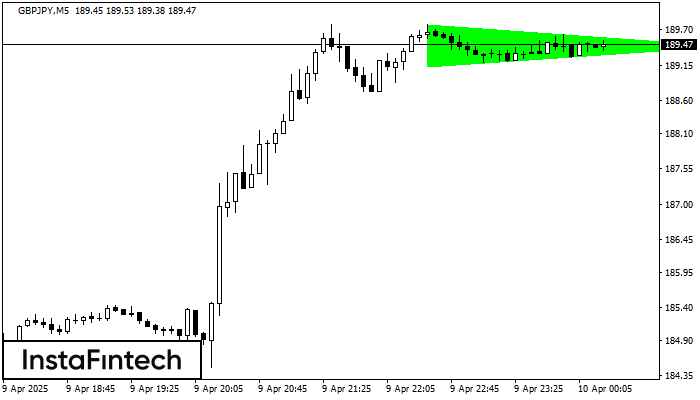
Según el gráfico de M5, el GBPJPY formó el patrón Triángulo Simétrico Alcista. El límite inferior del patrón toca las coordenadas 189.13/189.44 donde el límite superior cruza 189.79/189.44
Los marcos de tiempo M5 y M15 pueden tener más puntos de entrada falsos.
Open chart in a new window