signal strength 1 of 5
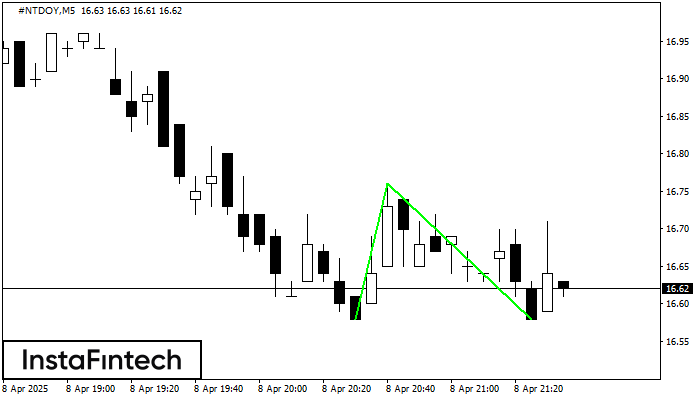
The Double Bottom pattern has been formed on #NTDOY M5. This formation signals a reversal of the trend from downwards to upwards. The signal is that a buy trade should be opened after the upper boundary of the pattern 16.76 is broken. The further movements will rely on the width of the current pattern 18 points.
The M5 and M15 time frames may have more false entry points.
Vea asimismo
- All
- Double Top
- Flag
- Head and Shoulders
- Pennant
- Rectangle
- Triangle
- Triple top
- All
- #AAPL
- #AMZN
- #Bitcoin
- #EBAY
- #FB
- #GOOG
- #INTC
- #KO
- #MA
- #MCD
- #MSFT
- #NTDOY
- #PEP
- #TSLA
- #TWTR
- AUDCAD
- AUDCHF
- AUDJPY
- AUDUSD
- EURCAD
- EURCHF
- EURGBP
- EURJPY
- EURNZD
- EURRUB
- EURUSD
- GBPAUD
- GBPCHF
- GBPJPY
- GBPUSD
- GOLD
- NZDCAD
- NZDCHF
- NZDJPY
- NZDUSD
- SILVER
- USDCAD
- USDCHF
- USDJPY
- USDRUB
- All
- M5
- M15
- M30
- H1
- D1
- All
- Buy
- Sale
- All
- 1
- 2
- 3
- 4
- 5
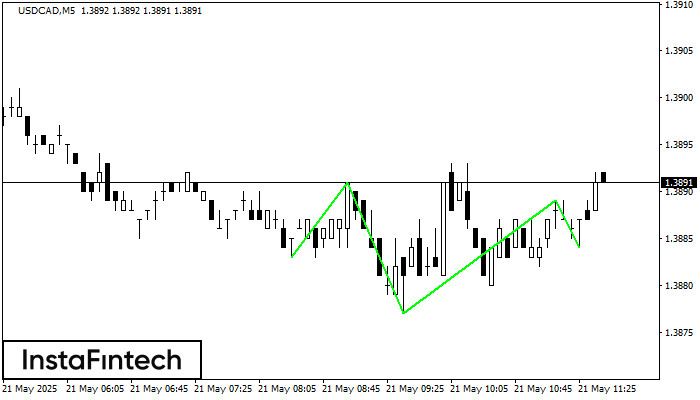
Según el gráfico de M5, USDCAD formó el patrón Cabeza y Hombros Inverso. El techo de la Cabeza está establecido en 1.3889 mientras la línea media del Cuello se encuentra
Los marcos de tiempo M5 y M15 pueden tener más puntos de entrada falsos.
Open chart in a new window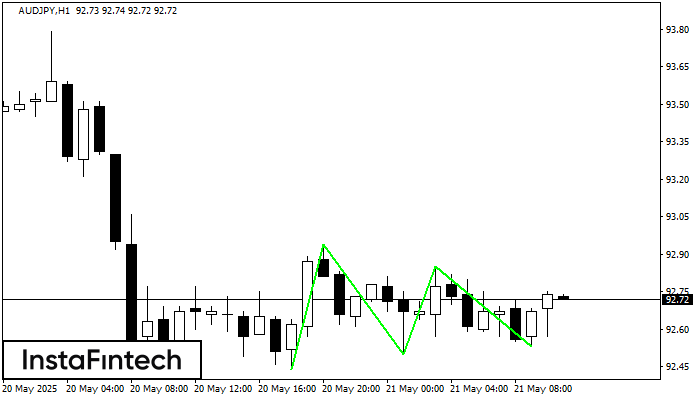
El patrón Triple Piso ha sido formado en AUDJPY H1. Este tiene las siguientes características: nivel de resistencia 92.94/92.85; nivel de soporte 92.44/92.53; el ancho es 50 puntos. En caso
Open chart in a new window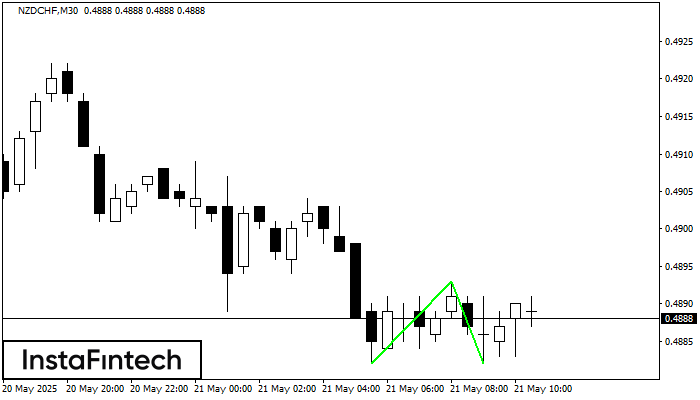
El patrón Doble Piso ha sido formado en NZDCHF M30. Características: el nivel de soporte 0.4882; el nivel de resistencia 0.4893; el ancho del patrón 11 puntos. Si el nivel
Open chart in a new window