Dolzarb patternlar
Паттерны – это графические модели, которые "рисует" цена на графике. Один из постулатов технического анализа говорит нам о том, что история (движение цены) всегда повторяется. Это значит, что в похожих ситуациях движение цены, зачастую, будет похожим, что позволяет с высокой долей вероятности спрогнозировать дальнейшее развитие ситуации.
Актуальные паттерны
- Все
- Вымпел
- Голова и плечи
- Двойная вершина
- Прямоугольник
- Треугольник
- Тройная вершина
- Флаг
- Все
- #AAPL
- #AMZN
- #Bitcoin
- #EBAY
- #FB
- #GOOG
- #INTC
- #KO
- #MA
- #MCD
- #MSFT
- #NTDOY
- #PEP
- #TSLA
- #TWTR
- AUDCAD
- AUDCHF
- AUDJPY
- AUDUSD
- EURCAD
- EURCHF
- EURGBP
- EURJPY
- EURNZD
- EURRUB
- EURUSD
- GBPAUD
- GBPCHF
- GBPJPY
- GBPUSD
- GOLD
- NZDCAD
- NZDCHF
- NZDJPY
- NZDUSD
- SILVER
- USDCAD
- USDCHF
- USDJPY
- USDRUB
- Все
- M5
- M15
- M30
- H1
- D1
- Все
- Покупка
- Продажа
- Все
- 1
- 2
- 3
- 4
- 5
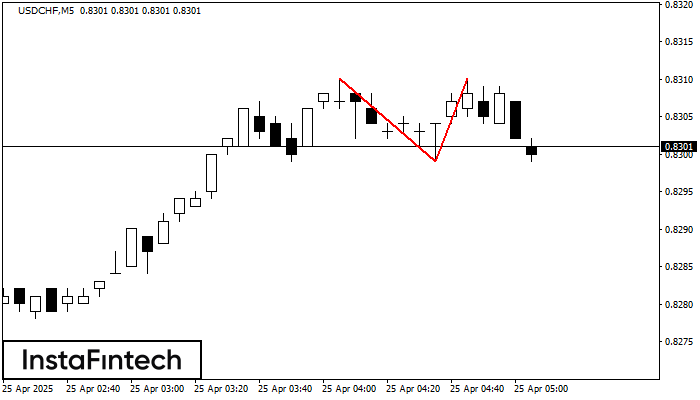
The Double Top reversal pattern has been formed on USDCHF M5. Characteristics: the upper boundary 0.8310; the lower boundary 0.8299; the width of the pattern is 11 points. Sell trades
The M5 and M15 time frames may have more false entry points.
Открыть график инструмента в новом окне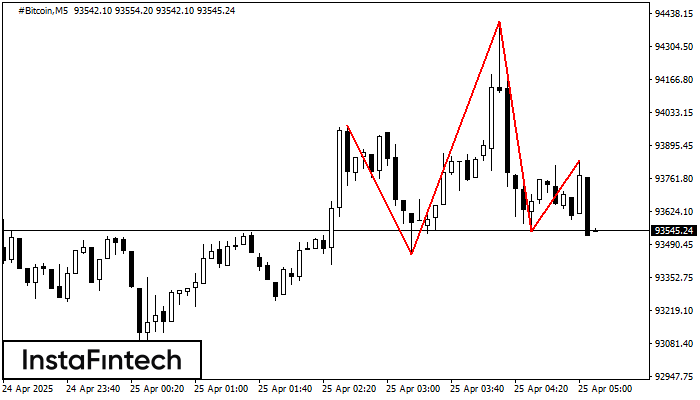
According to the chart of M5, #Bitcoin formed the Head and Shoulders pattern. The Head’s top is set at 94406.22 while the median line of the Neck is found
The M5 and M15 time frames may have more false entry points.
Открыть график инструмента в новом окне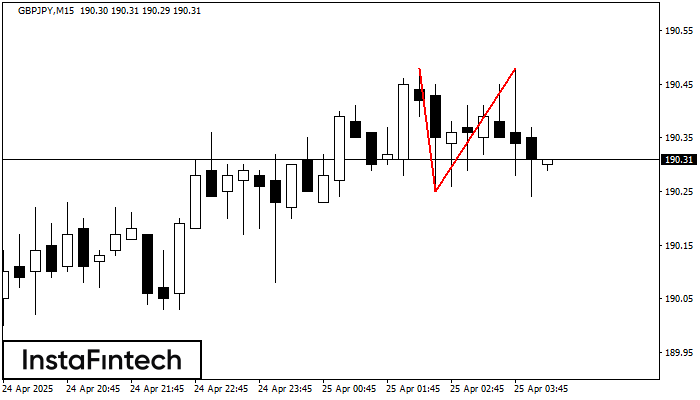
The Double Top reversal pattern has been formed on GBPJPY M15. Characteristics: the upper boundary 190.48; the lower boundary 190.25; the width of the pattern is 23 points. Sell trades
The M5 and M15 time frames may have more false entry points.
Открыть график инструмента в новом окне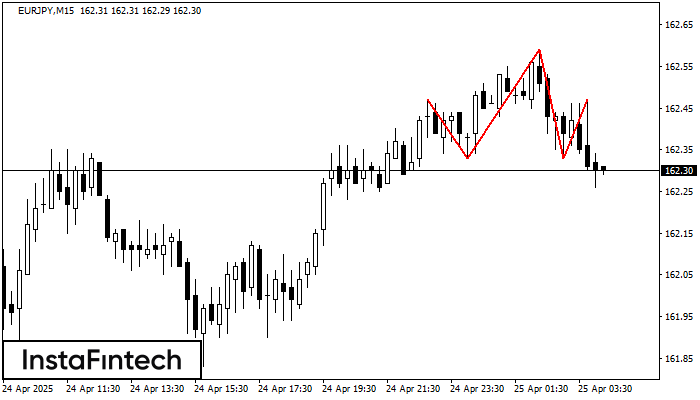
According to the chart of M15, EURJPY formed the Head and Shoulders pattern. The Head’s top is set at 162.59 while the median line of the Neck is found
The M5 and M15 time frames may have more false entry points.
Открыть график инструмента в новом окне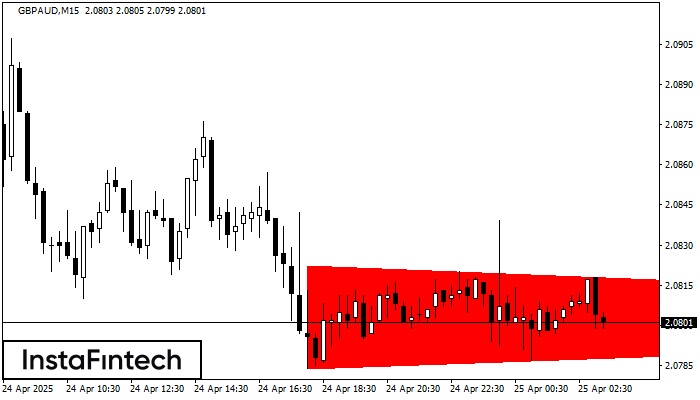
According to the chart of M15, GBPAUD formed the Bearish Symmetrical Triangle pattern. Description: The lower border is 2.0784/2.0802 and upper border is 2.0822/2.0802. The pattern width is measured
The M5 and M15 time frames may have more false entry points.
Открыть график инструмента в новом окне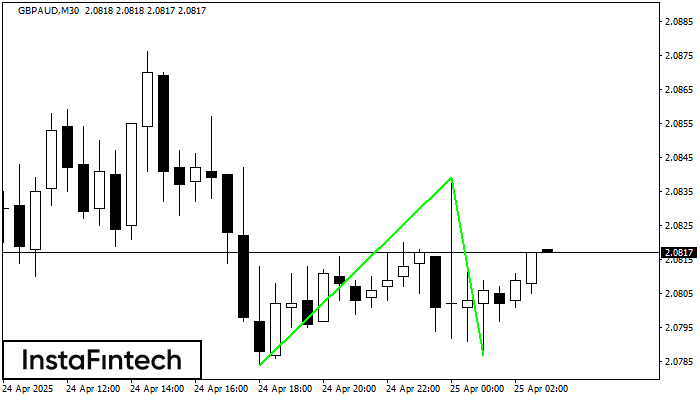
The Double Bottom pattern has been formed on GBPAUD M30. Characteristics: the support level 2.0784; the resistance level 2.0839; the width of the pattern 55 points. If the resistance level
Открыть график инструмента в новом окне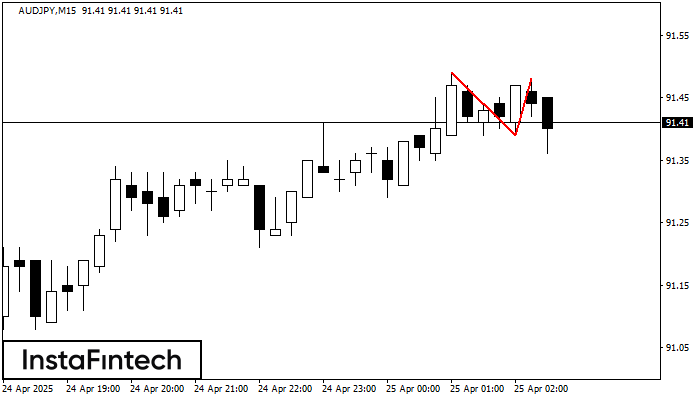
On the chart of AUDJPY M15 the Double Top reversal pattern has been formed. Characteristics: the upper boundary 91.48; the lower boundary 91.39; the width of the pattern 9 points
The M5 and M15 time frames may have more false entry points.
Открыть график инструмента в новом окне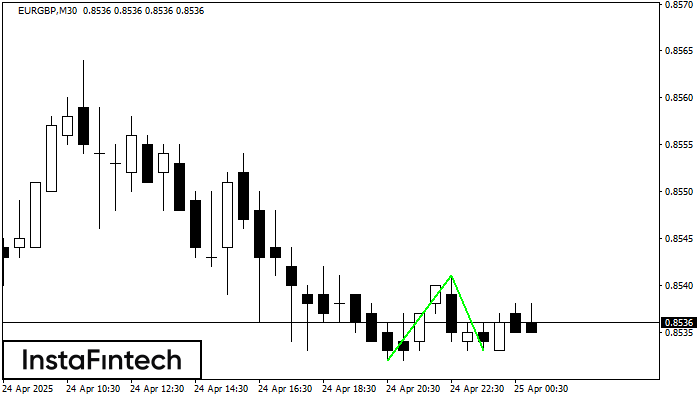
The Double Bottom pattern has been formed on EURGBP M30. Characteristics: the support level 0.8532; the resistance level 0.8541; the width of the pattern 9 points. If the resistance level
Открыть график инструмента в новом окне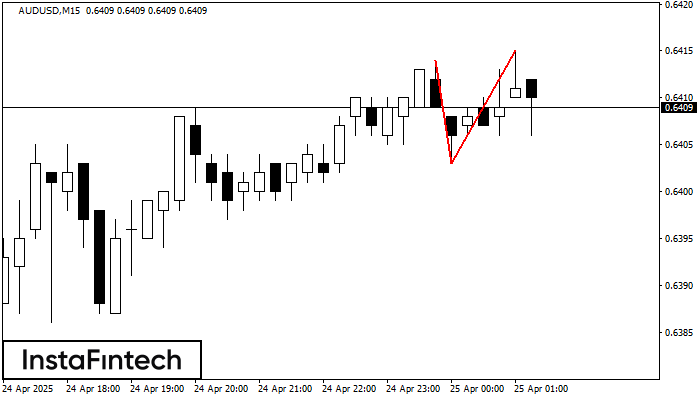
On the chart of AUDUSD M15 the Double Top reversal pattern has been formed. Characteristics: the upper boundary 0.6415; the lower boundary 0.6403; the width of the pattern 12 points
The M5 and M15 time frames may have more false entry points.
Открыть график инструмента в новом окне